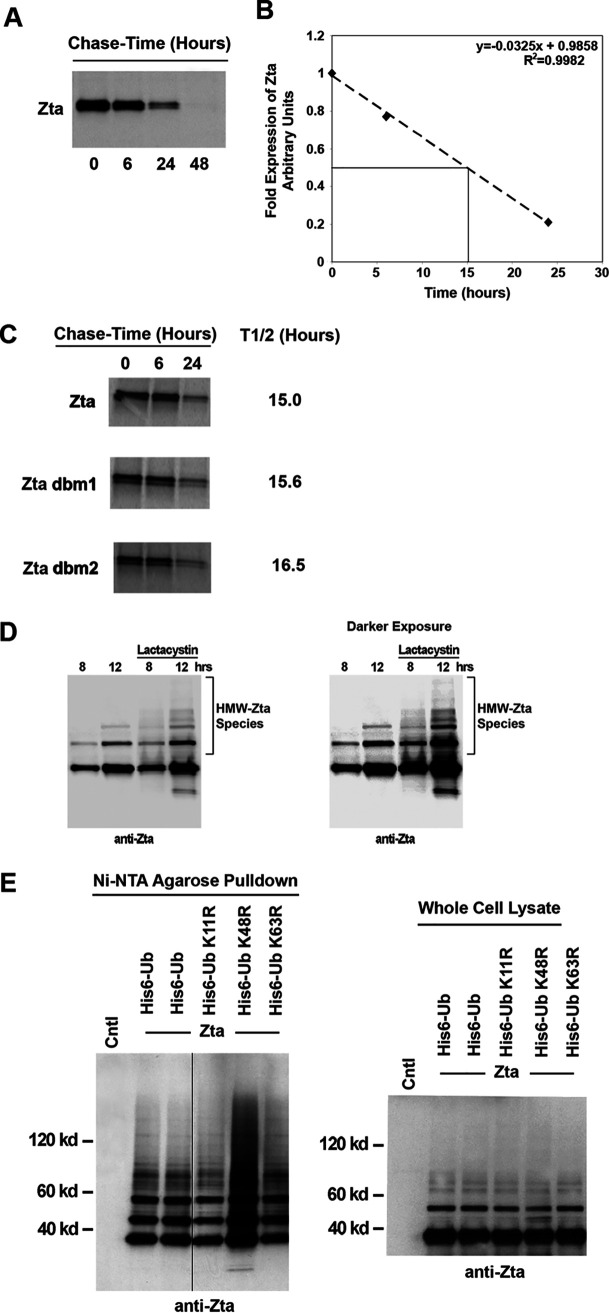
FIG 6.
Analysis of ubiquitination-dependent degradation of Zta. (A) EBV-negative U2OS osteosarcoma cells were transfected with a Zta expression plasmid and split into four different plates the following day. Two days after transfection, cells were pulsed with [35S]methionine and chased for the indicated times. Extracts were prepared under denaturing conditions and immunoprecipitated with an anti-Zta MAb. Samples were analyzed by SDS-PAGE and autoradiography. (B) The experiment shown in panel A was analyzed using a PhosphorImager to quantitate the levels of Zta immunoprecipitated at the different chase time points. The abundance at each time point was calculated relative to the abundance at 0 h. The line was generated by linear regression of the data in panel A. (C) U2OS cells were transiently transfected with either wild-type Zta or mutant expression plasmids and pulse-chase analysis was performed. (D) NPC-KT cells were transfected with Zta expression vector and treated for the indicated periods of time with 10 μM lactacystin or a vehicle. Aliquots from cell extracts were immunoblotted with the anti-Zta monoclonal antibody. A species of high-molecular-weight Zta (HMW-Zta) were readily detected at 12 h posttreatment with lactacystin but not with the vehicle. (E) NPC-KT cells were transfected with 5 μg of either wild-type ubiquitin (His6-Myc-Ub) or its mutant expression vectors plus 5 μg of the Zta expression plasmid or its control vector. Cells were lysed under denaturing conditions and extracts were purified over nickel-NTA beads. The purified material was assayed by Western blot analysis employing an anti-Zta antibody. Expression levels of Zta and its mutants were determined by Western blot analysis of whole-cell lysates. The image was spliced to unify the Western blot format.

