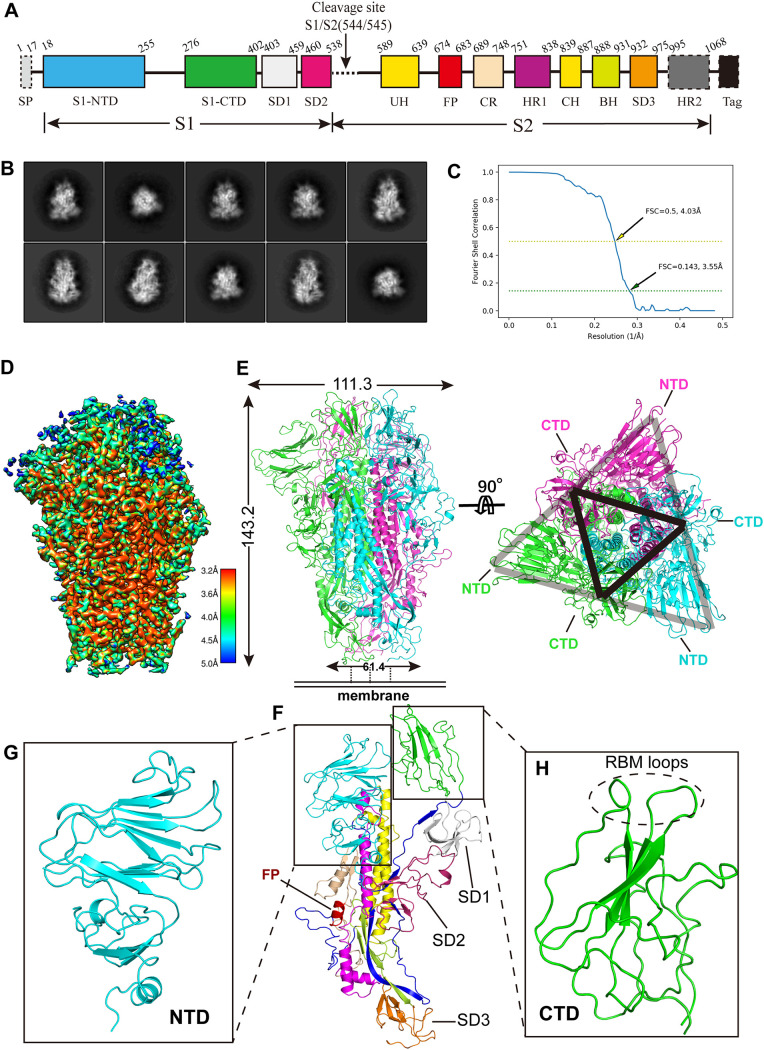
FIG 1.
The 3.55-Å cryo-EM structure of the SADS-CoV S trimer in the prefusion conformation. (A) Domain arrangement of the SADS-CoV S ectodomain. S1, receptor-binding subunit; S2, membrane-fusion subunit; SP, signal peptide; S1-NTD, N-terminal domain of S1; S1-CTD, C-terminal domain of S1; SD1 to SD3, subdomains 1 to 3, respectively; FP, fusion peptide; UH, upstream helix; CH, central helix; HR1 and HR2, heptad repeats 1 and 2, respectively; Tag, GCN4 trimerization tag followed by an 8×His tag. Regions indicated by dotted rectangles (signal peptide, HR2, and GCN4 tag and 8×His tag) were not included in the structural model. (B) Representative 2D class averages of SADS-CoV S trimer in different orientations. (C) Gold-standard FSC curve of SADS-CoV S. The resolution was determined to be 3.55 Å at an FSC threshold criterion of 0.143. The yellow dashed line indicates the cutoff FSC value of 0.5, which corresponds to a resolution of 4.03 Å. (D) Final cryo-EM density map of SADS-CoV S colored according to the local resolution. (E) (Left) Ribbon diagram of the SADS-CoV S trimer in the prefusion conformation. The three S subunits are in green, cyan, and magenta. (Right) Same as the left panel, but the SADS-CoV S trimer was rotated 90 degrees to show the top view of the trimer cap. The locations of the S1-CTDs of each protomer can be seen as a vertex of the black triangle. Each S1-CTD is sandwiched by two S1-NTDs, one from the same protomer and one from the adjacent protomer, thus forming one side of the gray triangle. (F) Ribbon diagram of a SADS-CoV S protomer. The structural elements are colored as described in panel A. (G and H) Structures of SADS-CoV S1-NTD (G) (cyan) and S1-CTD (H) (green). The putative RBM loops are indicated by a dashed circle.

