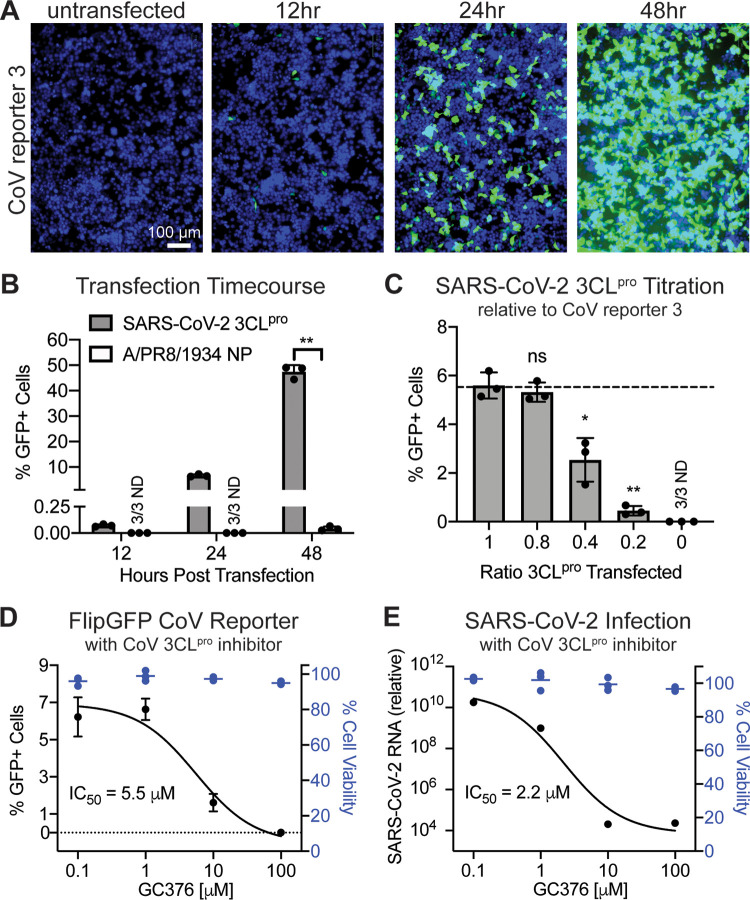
FIG 3.
Inhibition of the SARS-CoV-2 3CLpro by the protease inhibitor GC376 is measurable with the fluorescent CoV protease reporter. (A) Microscopy of 293T cells before or 12, 24, and 48 h after transfection with CoV reporter 3 and SARS-CoV-2 3CLpro. Green, cleaved FlipGFP; blue, nuclei. (B) Quantification of data in panel A. Data are shown as means ± SDs (n = 3); statistical analysis is relative to the NP control. P values were calculated using unpaired, two-tailed Student’s t tests (*, P < 0.05; **, P < 0.001). (C) Quantification of 293T cells 24 h after transfection with CoV reporter 3 and SARS-CoV-2 3CLpro, with decreasing levels of 3CLpro. Data are shown as means ± SDs (n = 3); statistical analysis is relative to a 1:1 ratio of reporter to protease. P values were calculated using unpaired, two-tailed Student’s t tests (*, P < 0.05; **, P < 0.001). (D) In black is quantification of 293T cells 24 h after transfection with CoV reporter 3 and SARS-CoV-2 3CLpro and treatment with the pan-coronavirus protease inhibitor GC376. Data are shown as means ± SDs with nonlinear fit curve (n = 3). In blue is calculation of cell viability relative to vehicle-only (DMSO) samples. (E) In black are results of RT-qPCR of VeroE6 cells 24 h after infection with SARS-CoV-2 at an MOI of 0.01 and treatment with the pan-coronavirus protease inhibitor GC376. Data are shown as means ± SDs with nonlinear fit curve (n = 4). In blue is calculation of cell viability relative to vehicle-only (DMSO) samples. Data are shown as means ± SDs (n = 3). Experiments were performed twice.

