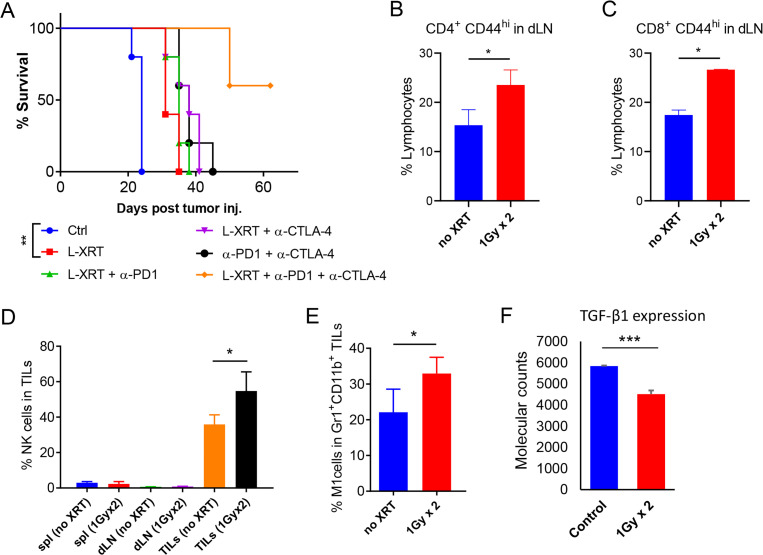
Figure 1.
L-XRT hampers tumor growth, activates T cells, increases NK cells and M1 macrophages, and downregulates the inhibitory cytokine TGF-β. (A), The one-tumor mouse model was established by injecting 344SQ-P cells (0.5 × 10⁶) into the right hind legs of 129Sv/Ev mice (n=5/group), after which L-XRT (1 Gy × 2 fractions) was delivered when tumors reached around 7–8 mm in diameter. Anti-PD1 (200 µg/inj.) and anti-CTLA-4 (50 µg/inj.) were administered intraperitoneally on days 5, 8, 12, and 16 post 344SQ-P injection. Mice were euthanized when tumor reached 14 mm, and survival was plotted by the Kaplan-Meier method. Experiment was repeated twice, and similar patterns were detected. (B and C) dLNs from the L-XRT dose groups were harvested at 3 days after radiation and analyzed with flow cytometry. Both CD4 (No XRT vs 1 Gy × 2, p=0.0318) and CD8 cells (No XRT vs 1 Gy × 2, p=0.0001) were activated after two 1 Gy fractions, as depicted by the activation marker CD44. (D and E), spleens (spl), dLNs, and TILs were harvested at 48 hours after two 1 Gy fractions for phenotyping by flow cytometry. (D) Cells were gated on the CD45+ population and then on CD49b+ to identify NK cells (TILs no XRT vs TILs 1 Gy × 2, p=0.0328). (E) Cells were gated on CD45+ and then on Gr1intermediate and CD11b+ to identify macrophages, and further gated on F4/80+ CD38hi to identify M1 macrophages (No XRT vs 1 Gy × 2, p=0.0463). (F) NanoString molecular counts (nCounter immunology panel) showed significant reduction in local TGF-β expression 24 hours after two 1 Gy fractions of L-XRT (p=0.0007). Data for each group was represented as mean±SD and Student’s t-tests were used to compare groups. *p≤0.05 was considered to indicate statistical significance. dLNs, draining lymph nodes; L-XRT, low-dose radiation; PD1, programmed cell death protein 1; TGF-β, tumor growth factor beta; TILs, tumor-infiltrating leukocytes.

