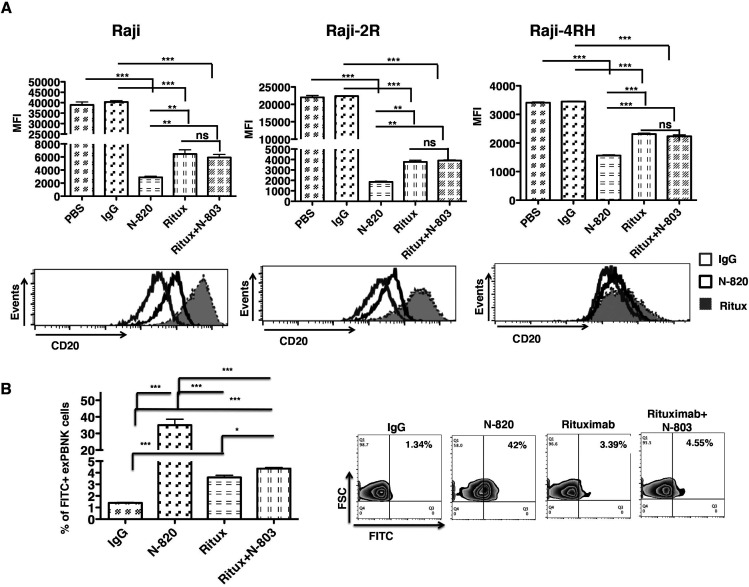
Figure 5.
The binding activity of N-820 to BL cells and to exPBNK cells. Raji, Raji-2R, or Raji-4RH were incubated with 10 nM IgG, 10 nM N-803, 10 nM N-820, 10 nM rituximab, or 10 nM N-803+10 nM rituximab for 30 min. The samples were washed three times in PBS. The cells were stained with phycoerythrin (PE) conjugated anti-CD20 antibody (clone LT20). The top panels show the median fluorescence intensity (MFI) of PE conjugated anti-CD20 antibody on Raji, Raji-2R, and Raji-4RH after incubating with N-820 and the indicated controls by flow cytometry analysis. The lower panels show the representative histograms of PE conjugated anti-CD20 antibody on Raji, Raji-2R, and Raji-4RH after incubating with N-820 and the indicated controls by flow cytometry analysis (A). The purified exPBNK cells were incubated with 10 nM IgG, 10 nM N-803, 10 nM N-820, 10 nM rituximab, 10 nM N-803+10 nM rituximab for 3 days. After PBS wash, the cells were stained with fluorescein isothiocyanate (FITC) conjugated goat anti-mouse anti-F(ab’) antibody (B). The left chart shows the percentage of FITC+ exPBNK cells. The right panel shows the representative contour plots of each group. Ritux=rituximab, **p<0.01, ***p<0.001.

