Fig. 5.
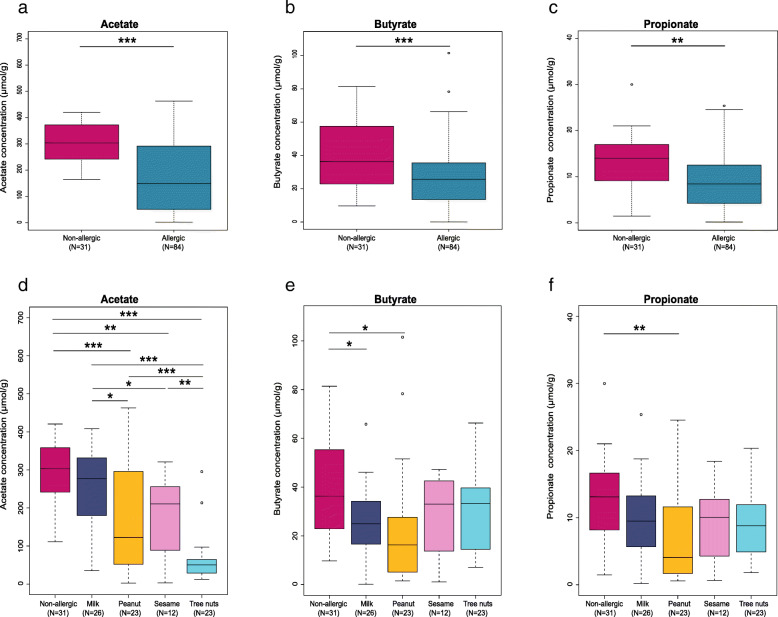
Food allergic patients have significantly lower stool SCFA concentrations compared to non-allergic controls. GC-MS analysis of a acetate, b butyrate, and c propionate concentrations in stool of allergic patients (N = 84) compared to the healthy non-allergic control group (N = 31). d Acetate, e butyrate, and f propionate concentrations in stool of non-allergic compared to the single FA individually; milk (N = 26), peanut (N = 23), sesame (N = 12), and tree nuts (N = 23) by ANOVA followed by pairwise t test and FDR correction. *q < 0.05, **q ≤ 0.01, ***q ≤ 0.001

