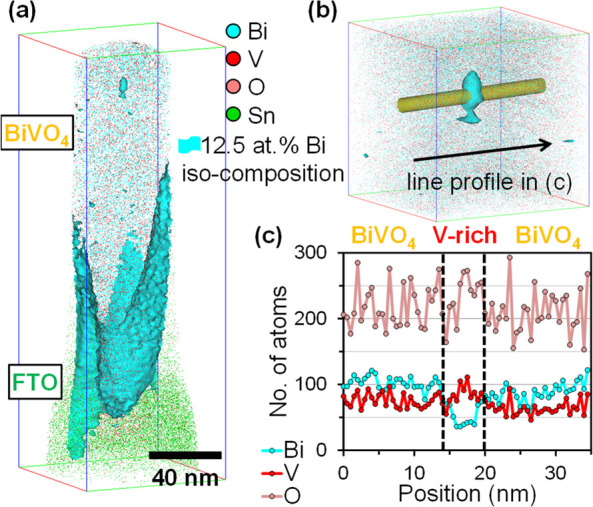
Figure 4.

(a) 3D atom map of a needle-shaped APT sample from a similar region as the yellow outline in Figure 3b, (b) sectioned volume with a cylindrical Φ4.3 × 35 nm3 region across a feature enveloped by the iso-composition surface of 12.5 at. % Bi, and (c) detected numbers of Bi, V, O atoms within the cylinder.
