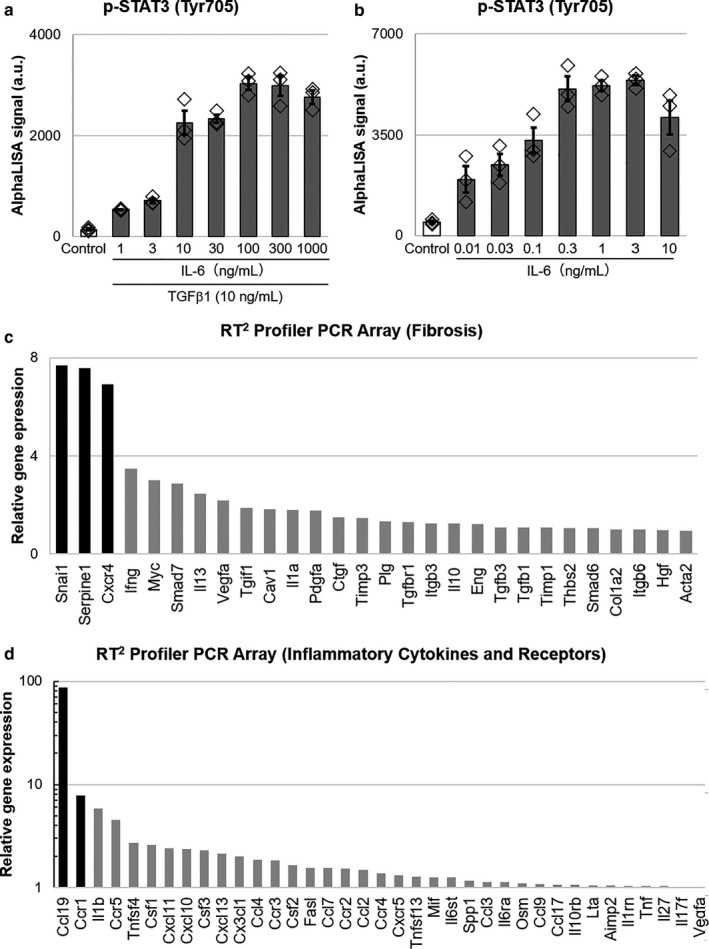
Figure 4.

Relative gene expression of IL‐6‐ and TGFβ1‐treated NRK‐49F cells, and IL‐6‐treated RAW264.7 cells. (a,b) STAT3 phosphorylation in NRK‐49F cells (a) and RAW264.7 cells (b) were evaluated by AlphaLISA. The cells were treated with IL‐6 and TGF‐β 1 (a) or IL‐6 only (b) for 10min. N = 3. (c,d) Relative gene expression of IL‐6 (10 ng/ml)‐ and TGFβ 1 (10 ng/ml)‐treated NRK‐49F cells (c), and IL‐6 (0.1 ng/ml)‐treated RAW264.7 cells (d). The cells were treated for 1h and mRNA was extracted. Gene expression was detected using an RT2 Profiler PCR Array Kit. Data are presented as fold change to control, and only upregulated genes are shown
