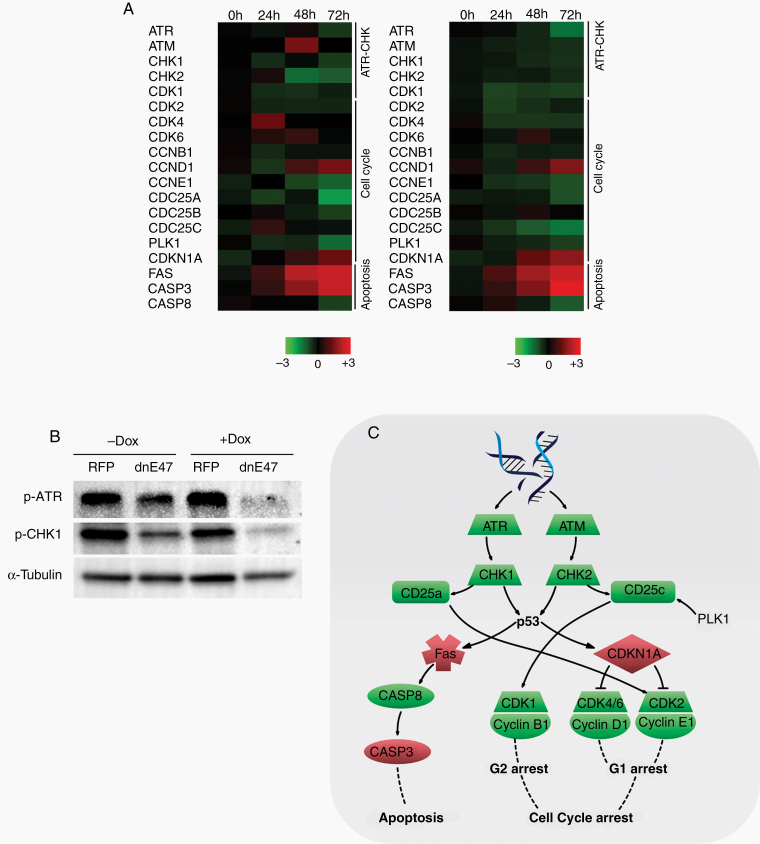
Figure 5.
The DNA damage response pathway is one effector pathway. (A) Heatmap showing enriched genes for the DNA damage pathway. Color-coding is based on differential log fold change expression values (dnE47 vs. RFP) with red representing higher signal and green representing lower signal relative to the mean. (B) Immunoblot for ATR, CHK1, and CHK2. (C) Schematic overview of the ATR DNA damage pathway.

