Figure 1.

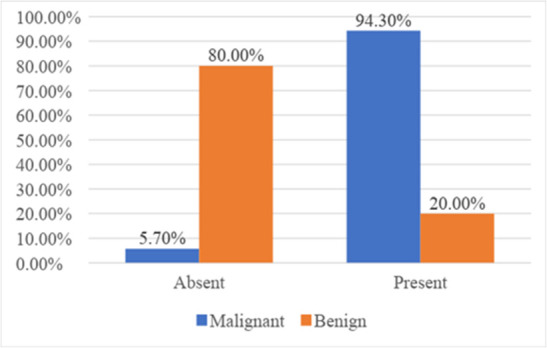
Bar diagram showing distribution based on morphology [diffusion restriction] of lesions on diffusion weighted image of MRI.

Bar diagram showing distribution based on morphology [diffusion restriction] of lesions on diffusion weighted image of MRI.