. 2020 Oct 28;128(10):107009. doi: 10.1289/EHP6976

Figure 1.

Figure 1 is a map of counties in the eastern half of the United States, including Florida, Georgia, South Carolina, North Carolina, Virginia, West Virginia, District of Columbia, Maryland, Delaware, New Jersey, Connecticut, Rhode Island, Massachusetts, Vermont, New Hemisphere, Maine, New York, Pennsylvania, Ohio, Virginia, Tennessee, Alabama, Mississippi, Louisiana, Arkansas, Missouri, Illinois, Indiana, Michigan, Wisconsin, Iowa, Kansas, Oklahoma, Texas, South Dakota, and Nebraska depicts the study area and storms. There are thin lines depicting paths of the study area and storms, which included all tracked storms from 1988 to 2018 that are recorded in the Northeast and North Central Pacific hurricane database and that came within 250 kilometers; and the thick lines depict the tracks of storms whose names have been retired, indicating that the storm was particularly severe or had notable impacts.

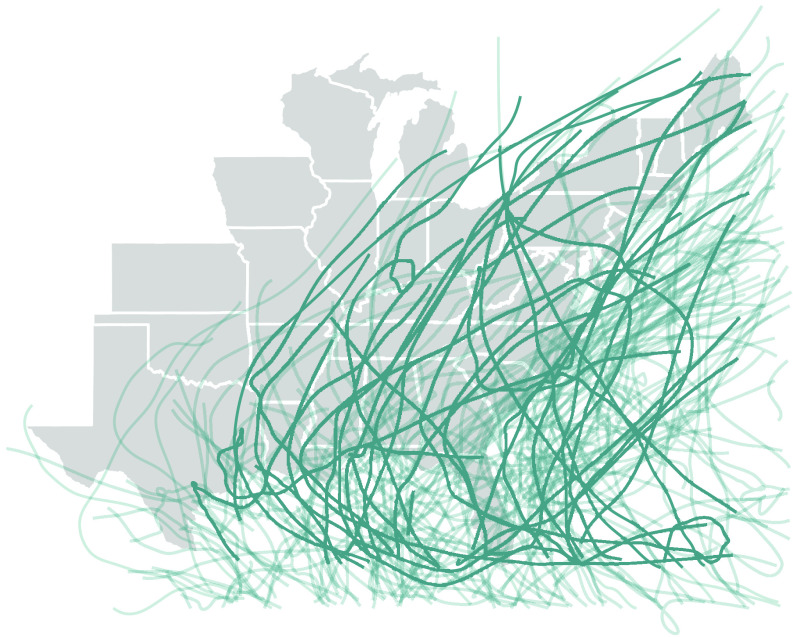
Study area and storms considered in this study. All counties in the states shown in this map were investigated. The lines show the paths of the study storms, which included all tracked storms in 1988–2018 that are recorded in HURDAT2 and that came within 250km of at least one U.S. county. Thicker lines show the tracks of storms whose names have been retired, indicating that the storm was particularly severe or had notable impacts.