
Figure 2.
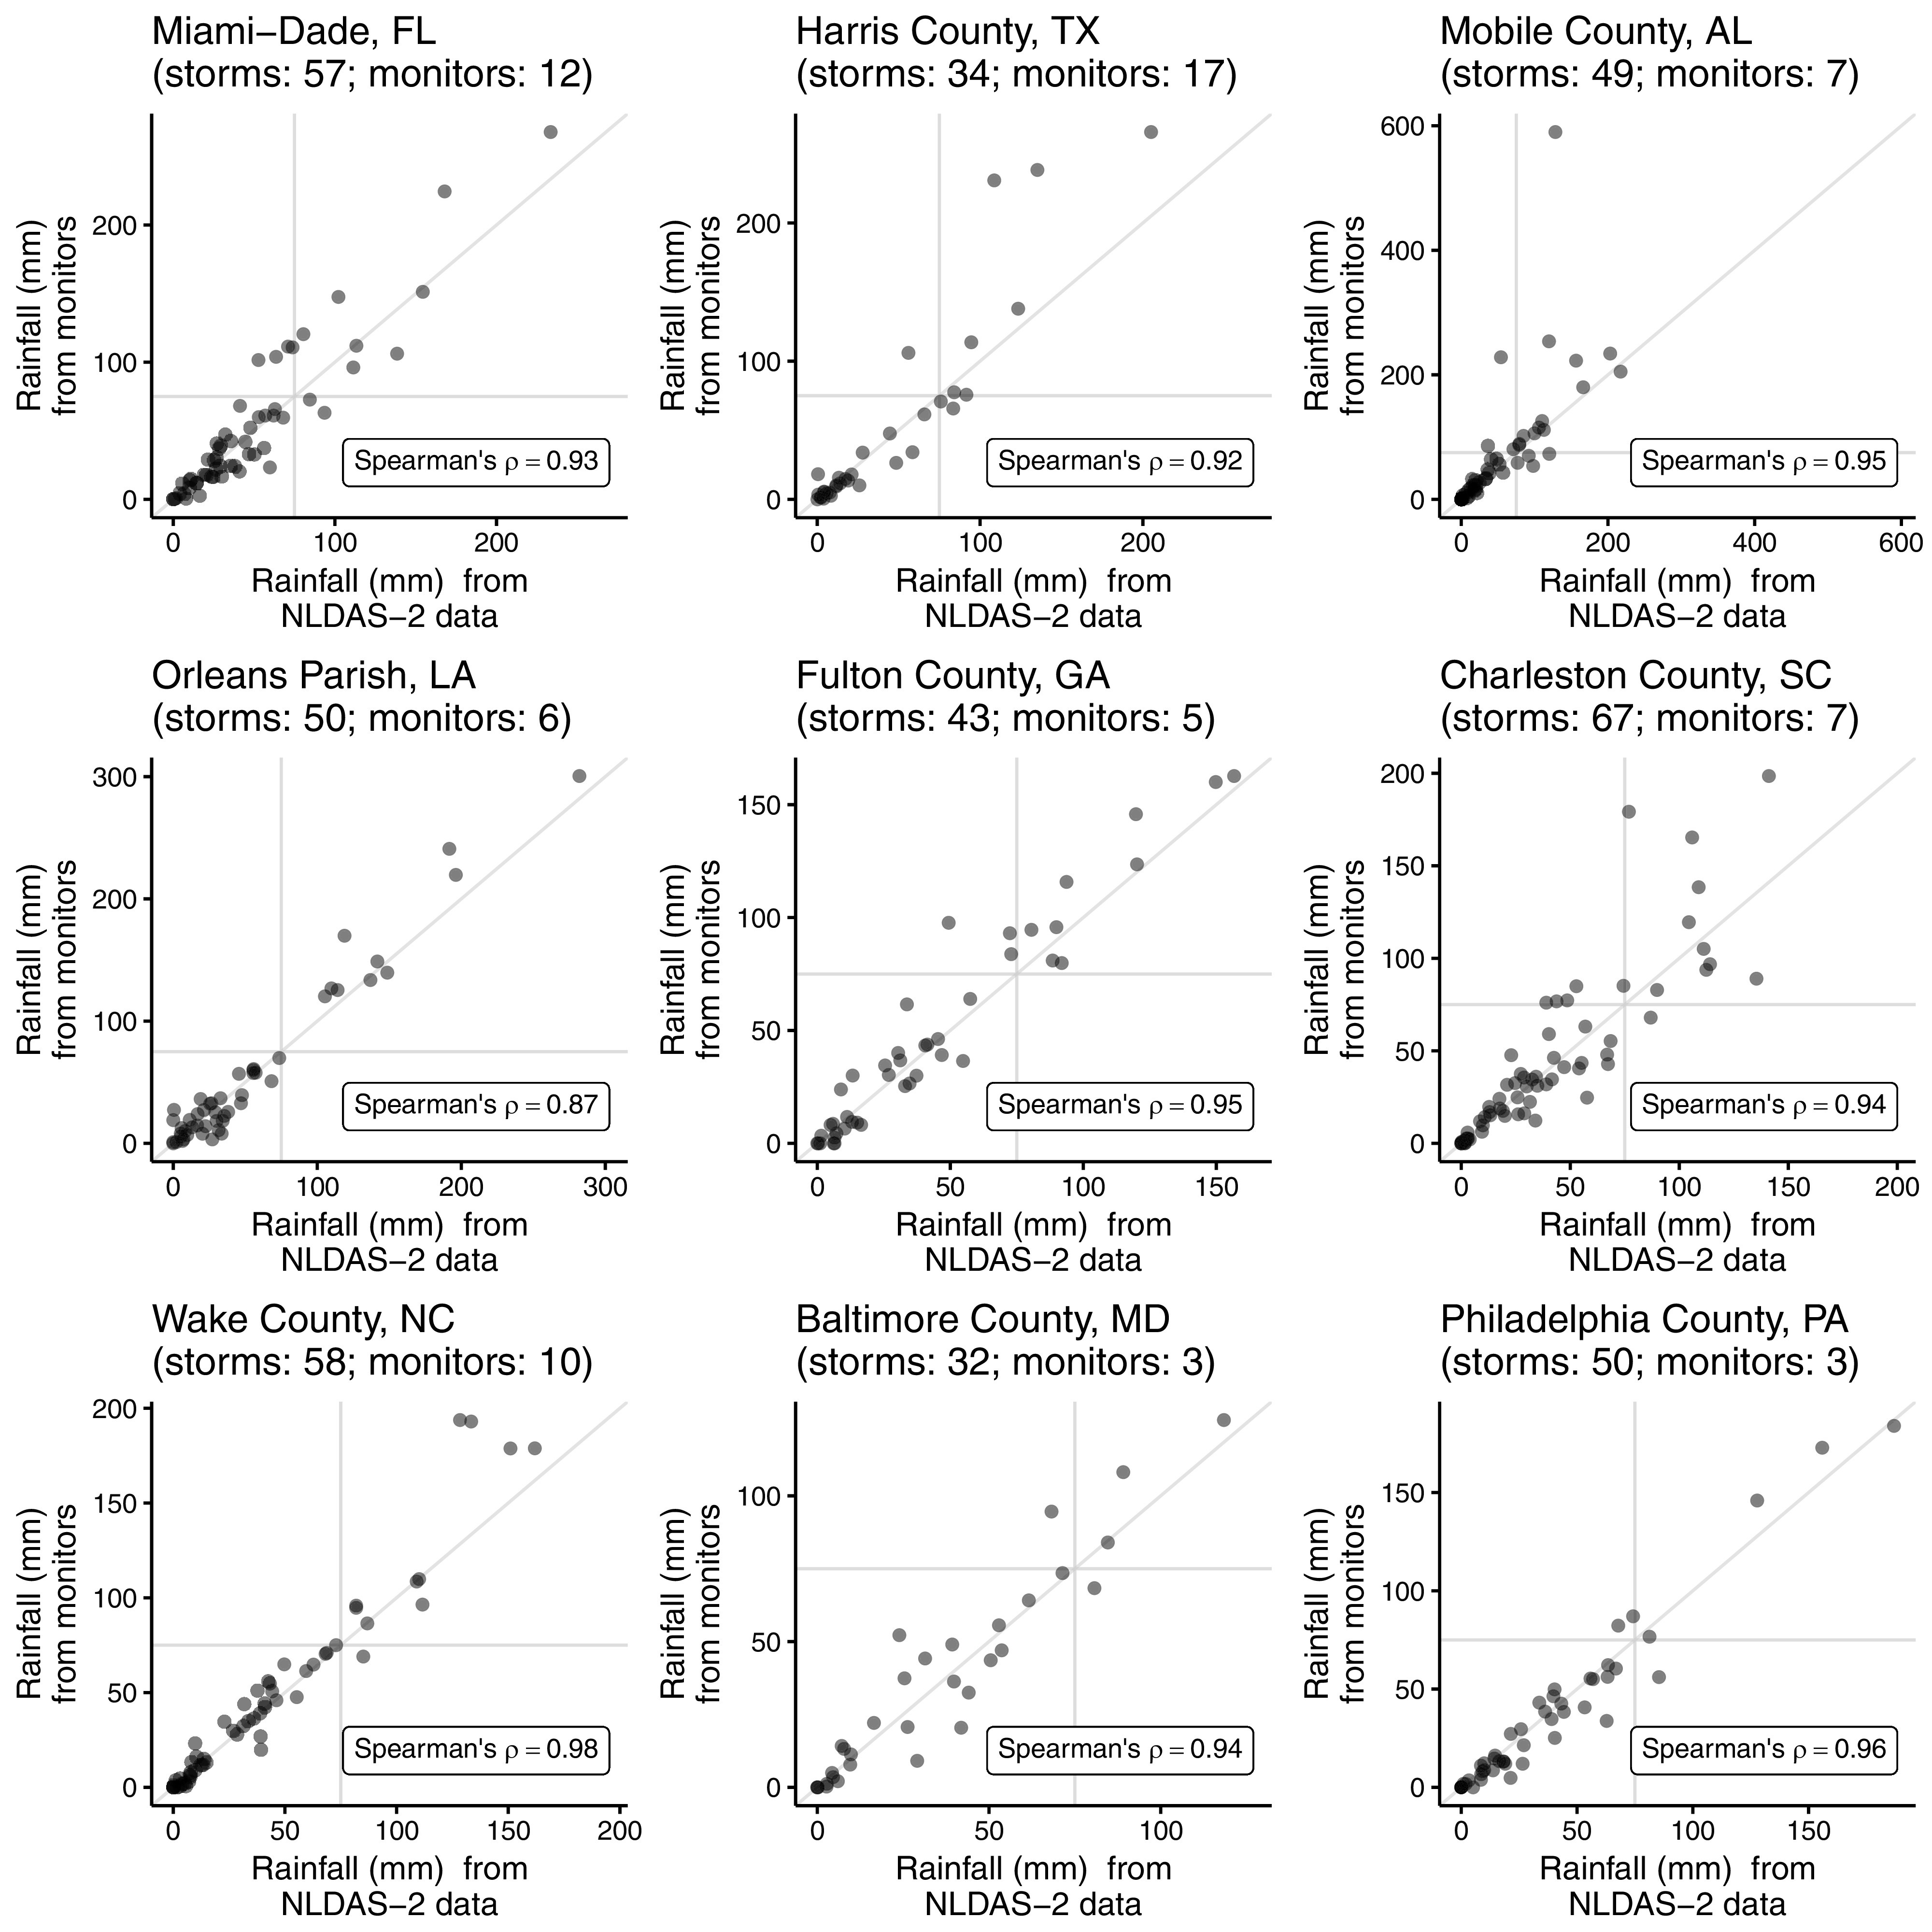
Comparison in nine sample counties of two sources of storm-associated rainfall estimates: (A) county-level estimates derived from a reanalysis data set and (B) county-level estimates based on ground-based observations in nine sample counties. For both, estimates include rainfall from 2 d before to 1 d after the storm’s closest approach to the county. Each small graph shows data for one sample county, and each point shows one tropical storm. The number of storms within each county and the number of ground-based monitors reporting precipitation during the county’s storms are given above each plot. Horizontal and vertical lines in each plot show the threshold of used to classify a storm as “exposed” for the binary classification considered for this metric in further analysis (Table 1). Note that ranges of the x and y axes differ across counties.