. 2020 Oct 28;128(10):107009. doi: 10.1289/EHP6976

Figure 3.

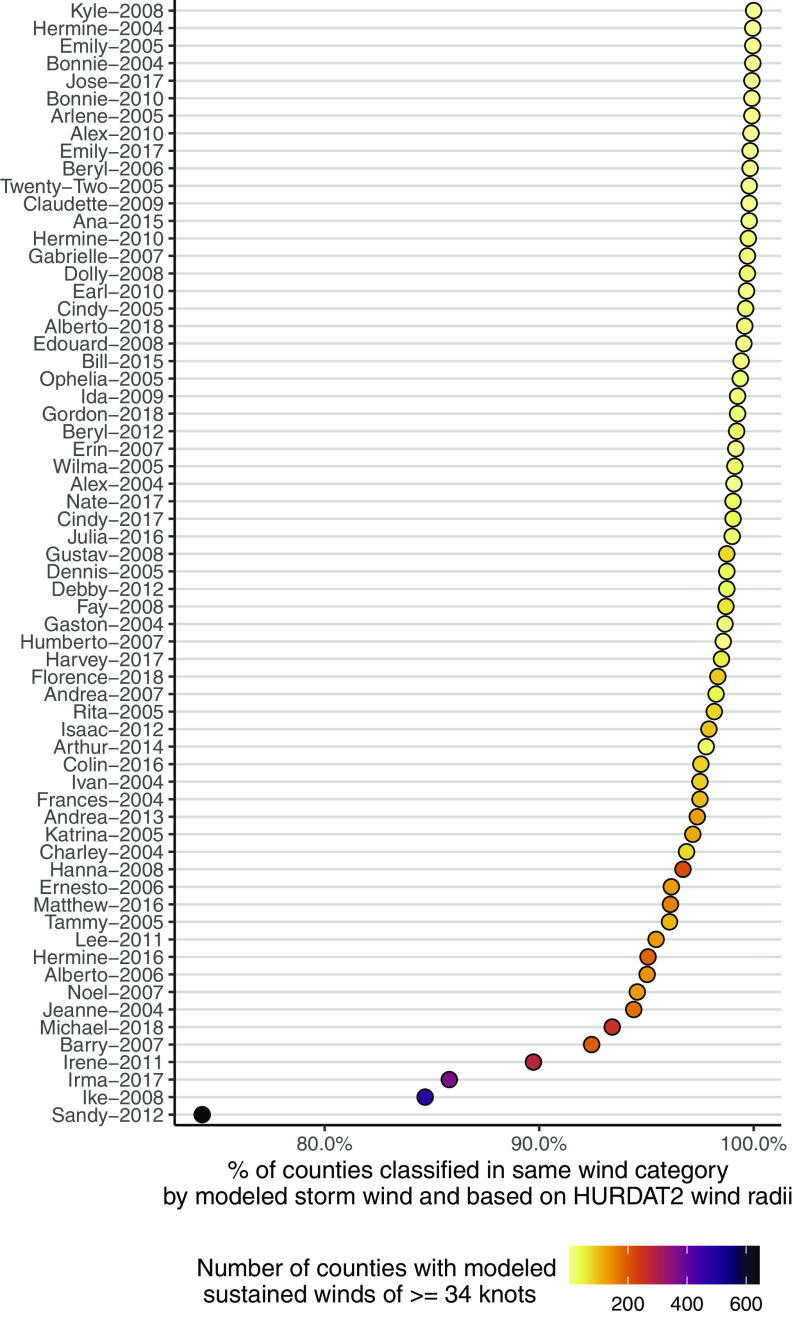
Figure 3 is a dot graph, depicting comparison of two sources of wind exposure estimates: modeled peak sustained surface wind and estimates based on the Northeast and North Central Pacific hurricane database’s wind speed radii by plotting Kyle−2008, Hermine−2004, Emily−2005, Bonnie−2004, Jose−2017, Bonnie−2010, Arlene−2005, Alex−2010, Emily−2017, Beryl−2006, Twenty−Two−2005, Claudette−2009, Ana−2015, Hermine−2010, Gabrielle−2007, Dolly−2008, Earl−2010, Cindy−2005, Alberto−2018, Edouard−2008, Bill−2015, Ophelia−2005, Ida−2009, Gordon−2018, Beryl−2012, Erin−2007, Wilma−2005, Alex−2004, Nate−2017, Cindy−2017, Julia−2016, Gustav−2008, Dennis−2005, Debby−2012, Fay−2008, Gaston−2004, Humberto−2007, Harvey−2017, Florence−2018, Andrea−2007, Rita−2005, Isaac−2012, Arthur−2014, Colin−2016, Ivan−2004, Frances−2004, Andrea−2013, Katrina−2005, Charley−2004, Hanna−2008, Ernesto−2006, Matthew−2016, Tammy−2005, Lee−2011, Hermine−2016, Alberto−2006, Noel−2007, Jeanne−2004, Michael−2018, Barry−2007, Irene−2011, Irma−2017, Ike−2008, and Sandy−2012 (y-axis) across percentage of counties classified in same wind category by modeled storm wind and based on HURDAT2 wind radii, ranging from 80.0 percent to 100.0 percent in increments of 10.0 (x-axis) for number of counties with modeled sustained winds of greater than or equal to 34 knots, ranging from 200 to 600 in increments of 200.

Comparison of two sources of wind exposure estimates: (A) modeled peak sustained surface wind and (B) estimates based on HURDAT2’s wind speed radii. Each point represents a storm, with the x-axis giving the percent of counties classified in the same category of peak sustained surface wind (<34 knots; 34–49.9 knots; 50–63.9 knots; 64 knots) by both sources of data. The color of each point gives the number of study counties that were exposed to peak sustained surface wind of at least 34 knots (based on modeled wind). Estimates are shown for study storms since 2004, the earliest year for which poststorm reanalysis wind speed radii are routinely available in HURDAT2, and for which at least one study county had a peak sustained wind of 34 knots based on the poststorm wind radii.