. 2020 Oct 28;128(10):107009. doi: 10.1289/EHP6976

Figure 7.

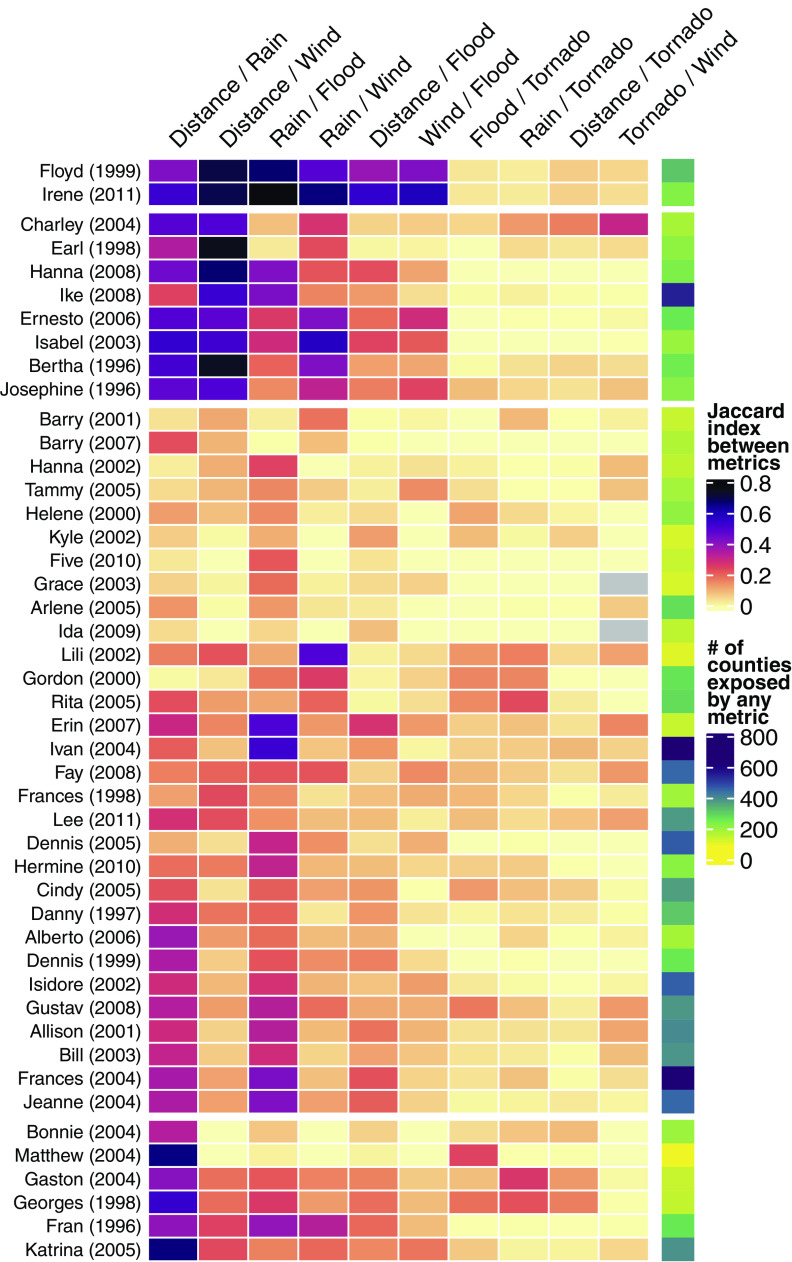
Figure 7 is a heatmap, depicting the different single-hazard exposure metrics for all storms between 1996 and 2011 by plotting Floyd (1999), Irene (2011), Charley (2004), Earl (1998), Hanna (2008), Ike (2008), Ernesto (2006), Isabel (2003), Bertha (1996), Josephine (1996), Barry (2001), Barry (2007), Hanna (2002), Tammy (2005), Helene (2000), Kyle (2002), Five (2010), Grace (2003), Arlene (2005), Ida (2009), Lili (2002), Gordon (2000), Rita (2005), Erin (2007), Ivan (2004), Fay (2008), Frances (1998), Lee (2011), Dennis (2005), Hermine (2010), Cindy (2005), Danny (1997), Alberto (2006), Dennis (1999, Isidore (2002), Gustav (2008), Allison (2001), Bill (2003), Frances (2004), Jeanne (2004), Bonnie (2004), Matthew (2004), Gaston (2004), Georges (1998), Fran (1996), and Katrina (2005) (y-axis) across Distance or Rain, Distance or Wind, Rain or Flood, Rain or Wind, Distance or Flood, Wind or Flood, Flood or Tornado, Rain or Tornado, Distance or Tornado, and Tornado or Wind (x-axis) for Jaccard Index between metrics, ranging from 0 to 0.8 in increments of 0.2 and number of Counties exposed by any metric, ranging from 0 to 800 in increments of 200.

Agreement between exposure classifications based on different single-hazard exposure metrics for all storms between 1996 and 2011 for which at least 100 counties were exposed based on at least one metric. Each row shows one storm, and the color of each cell shows the measured Jaccard index for each pair of exposure metrics (proportion of counties classified as exposed by both metrics out of counties classified as exposed by either metric). For Grace in 2003 and Ida in 2009, there were no county exposures for either the tornado-based metric or the wind-based metric (indicated by gray squares). Colors to the right of the heatmap show the number of exposed counties based on any of the metrics, and this panel is linked with the color scale labeled “# of counties exposed by any metric.” Storms are displayed within clusters that have similar patterns based on hierarchical clustering.