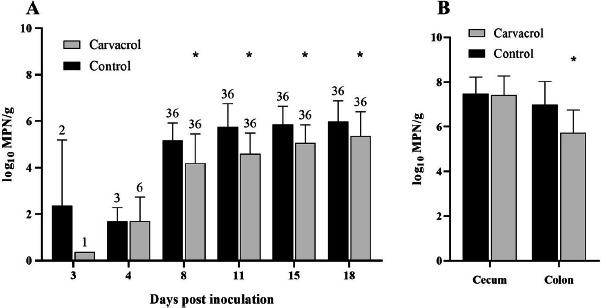
Fig. 1.

(A) Mean log10 most probable number (MPN) of C. jejuni per gram in cloacal swabs at each point in time after inoculation. (B) Mean log10 MPN of C. jejuni per gram in intestinal content. Black bars represent the control group (broilers challenged with C. jejuni and not treated with carvacrol); gray bars represent broilers challenged with C. jejuni and treated with 120 mg/kg feed of carvacrol. The data presented was obtained from 36 broilers/group after necropsy. Bars marked by an asterisk differ significantly (P < 0.05).
