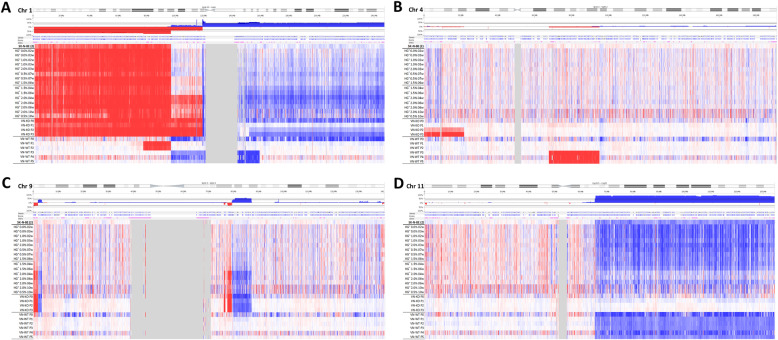
Fig. 2.
Detail of chromosomes 1 (a), 4 (b), 9 (c) and 11 (d) profiles of samples derived from SK-N-BE(2) cell line, as examples of clonal evolution. The color and intensity of each probe denotes whether it is gained (blue) or lost (red). a 1p-(pter-21.3) is present in all samples except those from RAG1−/−VN+/+ mice where it is substituted by CNLOH. 1p(21.3–12) is gained or lost in some samples with different percentage of affected cells. +1q(21.3-ter) is shown in many of the hydrogels in a very low cell percentage, and is clearly observed in those with high AlgMA percentage and longest culture times, and also in samples from VN-KO mice. b P2 and P3 tumors from VN-KO mice had a typical 4p-(ter-15.2). c The percentage of clones affected with FSCAs and SCA of chromosome 9 are shown in a high proportion in the stiffest and long-time culture hydrogels and in VT-KO tumors, but not in VN-WT tumors. d +11q(13.1-qter) was negative selected in tumors from VN-KO mice and in stiff and long culture-time hydrogels. All chromosome profile representations were obtained with Nexus 10.0 software

