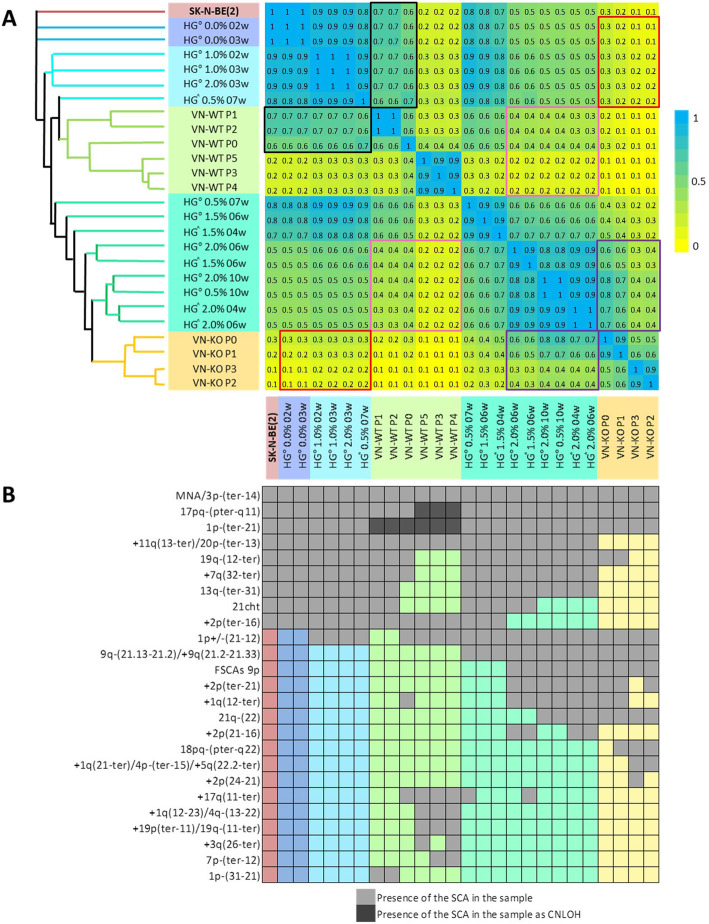
Fig. 3.
a Neighbor-joining tree clustering and matrix of similarity and distance indices based on the Jaccard coefficient. The highest Jaccard coefficient between samples (equal or near to 1) are represented in blue in the matrix, and with nearby branches of the same color in the tree. Lower Jaccard coefficients show a progressive fading towards yellow (equal or close to 0) and a greater distance between tree clusters. Note that softer and/or shorter cultivated hydrogels had higher similarity indices with VN-WT P0-P2 (marked in black boxes) than with VN-KO tumors (marked in red boxes) and are also nearer in the tree. Comparably, stiffer and/or longer cultivated hydrogels correlated better with VN-KO tumors (marked in purple boxes) than with VN-WT ones (marked in pink boxes), showing even smaller indices with P3 to P5. Stiffer and/or longer-time cultured hydrogels and VN-KO are clustered closer in the tree. b Genomic aberrations and their relationships with the models according to their presence and length, and related to the Jaccard proximity at the tree. Multivariate analysis was performed with PAST software in function to the chromosomal aberrations detected in each sample derived from the SK-N-BE(2) cell line. Presence of the SCAs in each sample is represented by light grey squares, SCAs as CNLOH by dark grey squares, and absence of genomic aberration is denoted by the remaining colors

