Fig. 4.

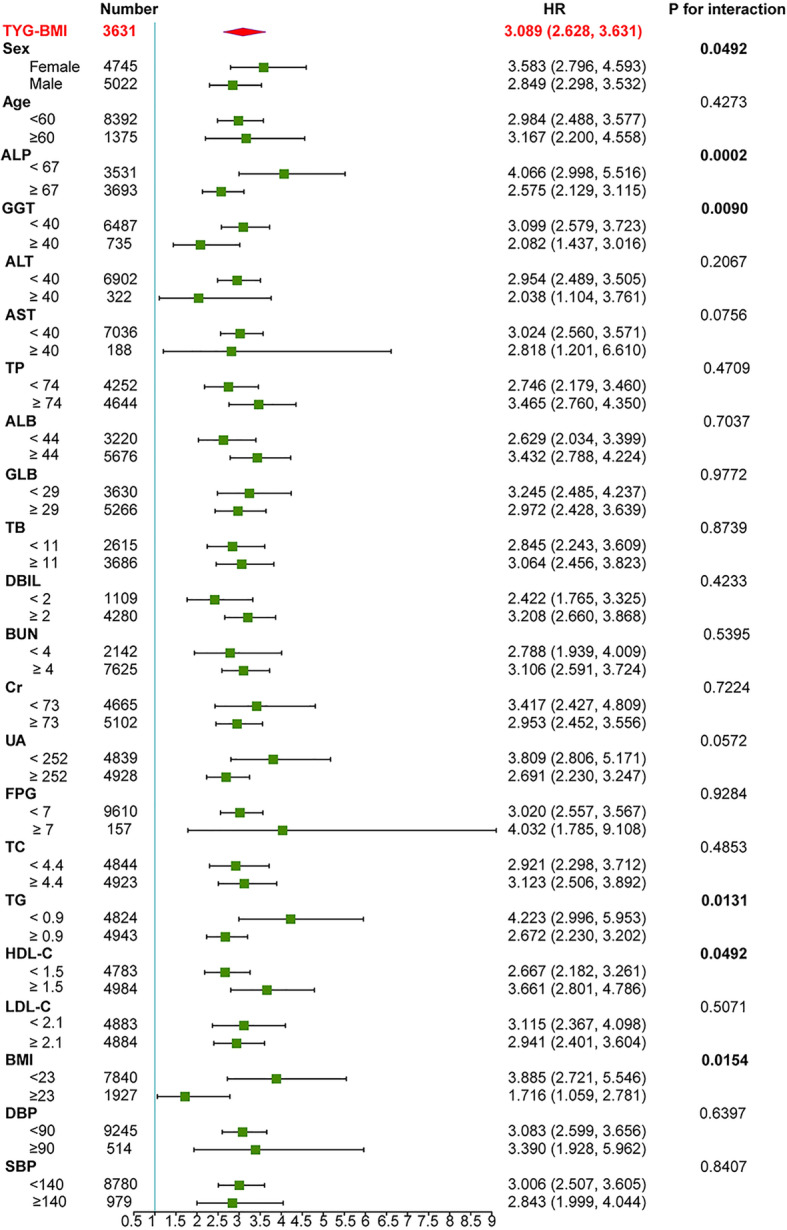
Subgroup analysis of the association between TyG-BMI and NAFLD. The HR (95% CI) was derived from the Cox regression model. (Sex, age, DBP, SBP, LDL-C, HDL-C, TG, UA, Cr, GLB, ALB, AST, ALP, GGT, ALT, FPG, and DBIL were adjusted)

Subgroup analysis of the association between TyG-BMI and NAFLD. The HR (95% CI) was derived from the Cox regression model. (Sex, age, DBP, SBP, LDL-C, HDL-C, TG, UA, Cr, GLB, ALB, AST, ALP, GGT, ALT, FPG, and DBIL were adjusted)