Fig. 5.
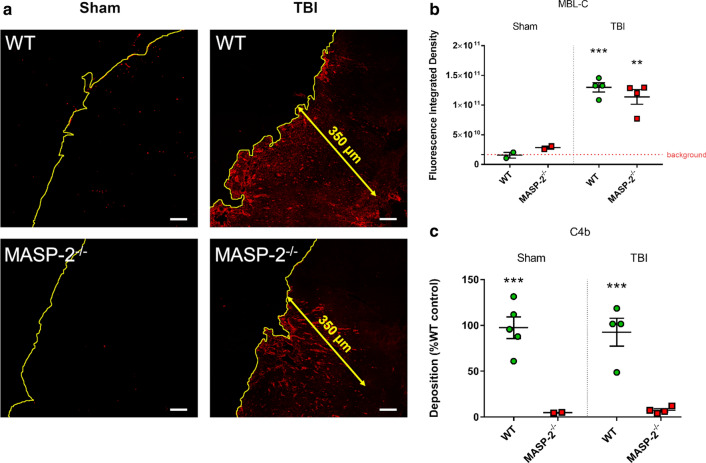
Brain MBL-C deposition and plasmatic LP activation 30′ after TBI in WT or MASP-2−/− mice. a Representative low-magnification images of MBL-C immunolabeling at 30′ after TBI or sham surgery (the cortical edge is outlined in yellow). MBL-C quantification was done over an area of 350 µm from the contusion edge (Fig. 2). Scale bars 50 μm. b MBL-C deposition in brains of MASP-2−/− mice was similar to that of WT. Data is shown as a scatter dot plot, line at mean ± SEM (n = 2–4). Two-way Anova followed by Sidak’s post hoc test, **p <0.01 compared with Sham MASP-2−/−, ***p < 0.001 compared with Sham WT. c In vitro assay for MBL-driven LP activation on mannan—plasma from MASP-2−/− lack C4 convertase activity, resulting in minimal C4b deposition compared to WT mice. The data is shown as a scatter dot plot, line at mean ± SEM (n = 2–4), Two-way Anova followed by Sidak’s post hoc test, ***p <0.001 compared with Sham or TBI WT

