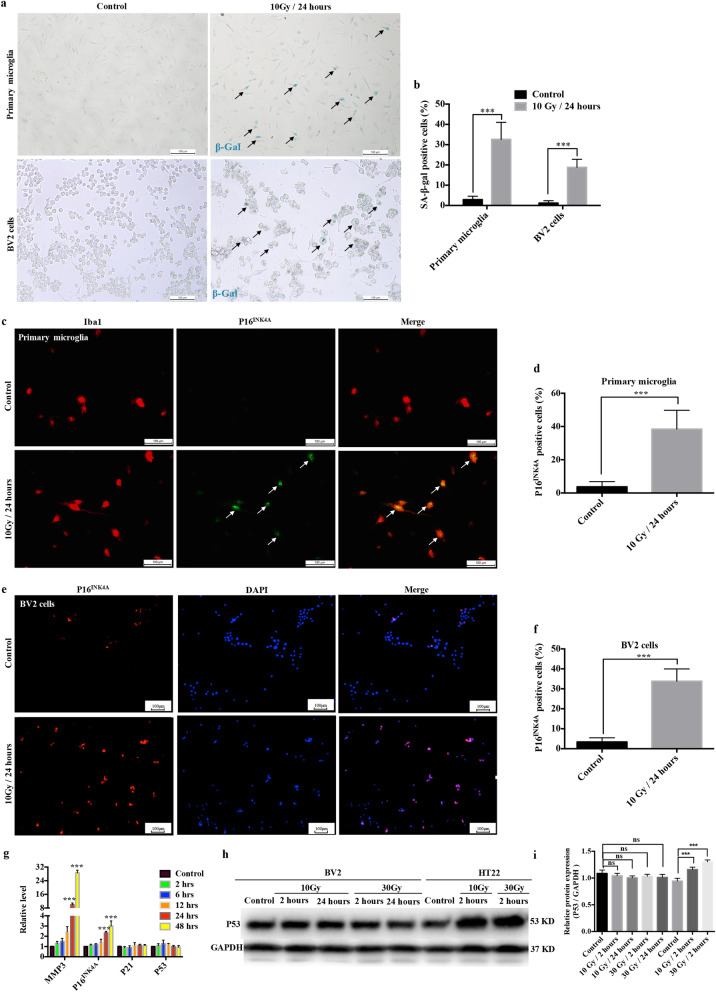
Fig. 1.
Irradiation induces microglial senescence in vitro. a Cytochemical staining for SA-β-gal in primary microglia and BV2 cells at 24 h after 10 Gy linac irradiation. Representative images are shown (scale bar, 100 μm). b The ratio of SA-β-gal positive cells is shown as the mean ± SEM; ***P < 0.001, versus the control group. c Primary microglia were exposed to a single dose of IR (10 Gy) by linac. Cells were immunostained with anti-Iba-1 (red) and anti-P16INK4A (green) antibodies 24 h after IR. Representative images are shown (scale bar, 100 μm). d The ratio of P16INK4A positive primary microglia is shown as the mean ± SEM; ***P < 0.001, versus the control group. e BV2 cells were exposed to a single dose of IR (10 Gy) by linac. Cells were immunostained with anti-P16INK4A antibody (red) 24 h after IR. Representative images are shown (scale bar, 100 μm). f The ratio of P16INK4A positive BV2 cells is shown as the mean ± SEM; ***P < 0.001, versus the control group. g Expression levels of Mmp3, Cdkn2a (P16INK4A), Cdkn1a (P21), and p53 in BV2 cells at different time points after 10 Gy IR by linac were examined using qRT-PCR (mean ± SEM, ***P < 0.001). h The protein levels of p53 from BV2 cells and HT22 cells after exposure to different doses at different time points, as examined using western blotting. i Histogram of the quantification of the immunoreactive protein bands on the western blots (mean ± SEM, ns, not significant, ***P < 0.001)

