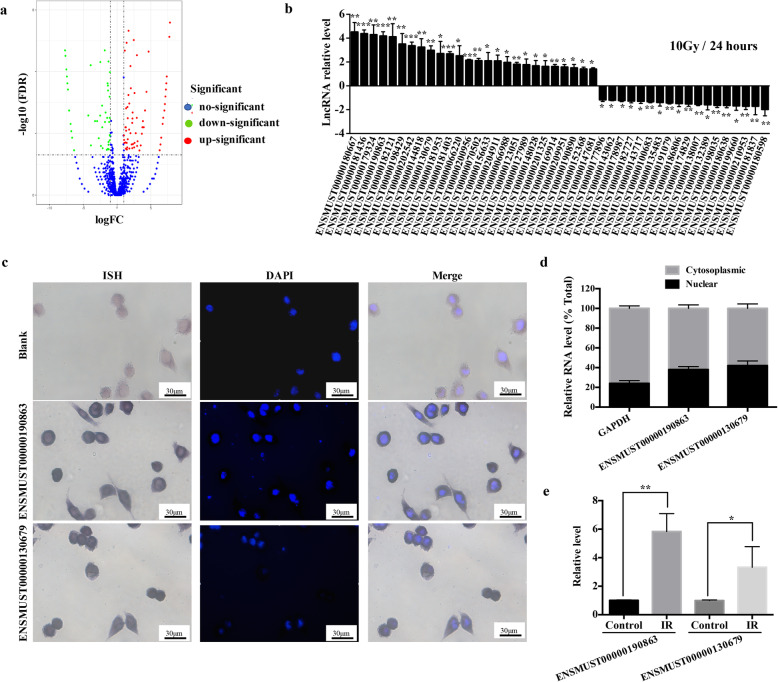
Fig. 4.
Differentially expressed LncRNAs in irradiated microglia. a To identify lncRNAs with altered expression in irradiated microglia, an RNA-seq analysis in BV2 cells was performed. A volcano plot shows the relationship between the magnitude and q values of the differences in the control and linac (10 Gy) groups. b Expression levels of top 26 upregulated lncRNAs and top 18 downregulated LncRNAs in BV2 cells, as verified using qRT-PCR at 24 h after exposure to linac (10 Gy) (mean ± SEM, *P < 0.05, **P < 0.01, ***P < 0.001). c BV2 cells were labeled with ENSMUST00000190863 or ENSMUST00000130679 probes (purplish-blue) using in situ hybridization (ISH), nuclei (blue) were stained using DAPI. Scale bar is 30 μm. d qRT-PCR analysis of RNAs purified from nuclear and cytoplasmic compartments in BV2 cells (mean ± SEM). e Effect of IR on selected LncRNAs (ENSMUST00000190863 and ENSMUST00000130679) of microglia isolated from the brain tissue of C57Bl6/J mice 24 h after IR, as determined using qRT-PCR (mean ± SEM, *P < 0.05, **P < 0.01)

