Fig. 7.
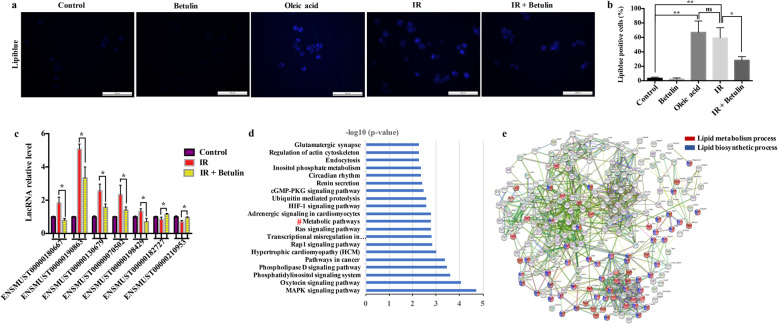
The reciprocal relationship between lipid metabolism and the RILs. a BV2 cells were exposed to 10 Gy using a linac at 5 h after treatment with/without 2 μM betulin. Representative micrographs of lipiblue staining in BV2 cells at 24 h after IR exposure. 100 μM Oleic acid (OA) treatment was used as the positive control. Scale bar = 100 μm. b Quantification of lipiblue positive cells (mean ± SEM, ns, not significant, *P < 0.05, **P < 0.01). c The relative expression levels of randomly selected RILs in BV2 cells at 24 h after exposure to 10 Gy using a linac with/without betulin (2 μM) (mean ± SEM, *P < 0.05). d KEGG was used to cluster 3589 neighboring protein genes of RILs (neighboring genes within 20 kilobase of the 84 upregulated and 64 downregulated RILs (FDR q value <0.05) in RNA-seq data). Hashes (#) represent 226 metabolism-related genes. e GO analysis identified 79 lipid metabolism-related genes (red), and 45 lipid biosynthetic metabolism-related genes (blue) from the RILs’ neighboring protein genes

