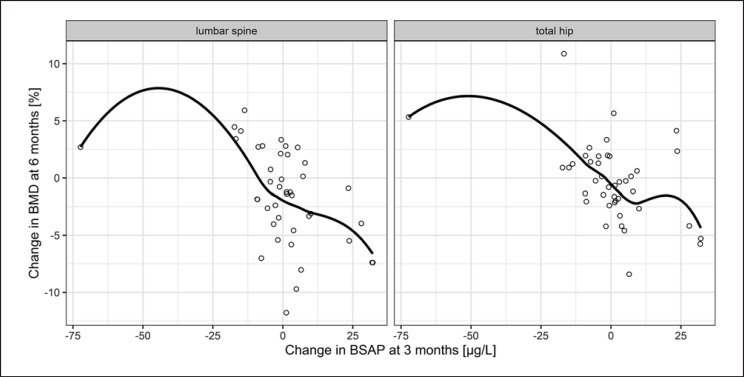
Fig. 2.
Correlation of BSAP and BMD in denosumab-naïve patients. Dots show the absolute change in BSAP at 3 months versus the percentage change in BMD at 6 months and the line shows the average trend by using locally weighted regression (loess) with a span (degree of smoothing) of 0.85. Spearman's rho was −0.476 for total hip and −0.506 for lumbar spine. BSAP, bone-specific alkaline phosphatase; BMD, bone mineral density.

