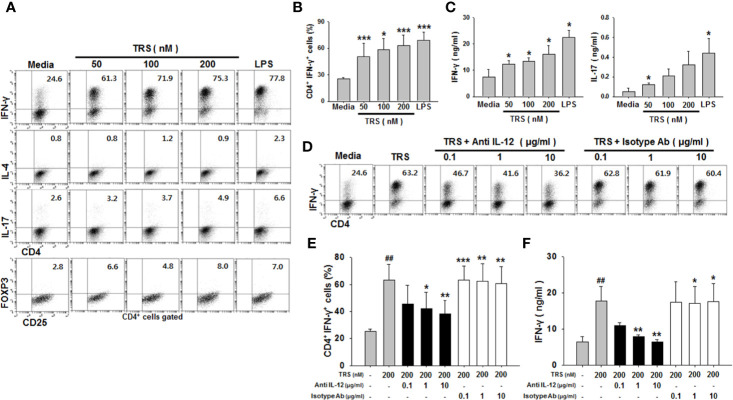
Figure 3.
Threonyl-tRNA synthetase (TRS) induces the polarization of Th1 cells through the secretion of IL-12 from DCs. Dendritic cells (DCs) were treated with ovalbumin (OVA, 10 μg/ml) for 2 h and OVA-DCs were treated with TRS (50, 100, and 200 nM) or LPS (500 ng/ml) for 6 h. DCs were cultured with OT-II CD4+ T cells at a 1:10 ratio for three days. (A) IFN-γ-, IL-4-, IL-17- and Foxp3-expressing CD4+ T cell populations, as analyzed by flow cytometry. Representative figures are presented. (B) The data are expressed as the mean ± SD of three independent experiments (n = 3). (C) Protein levels of IFN-γ and IL-17 in the supernatant, as analyzed using ELISA. Data shown represent the mean ± SEM of three independent experiments (n = 3). (B, C) *P < 0.05, and ***P < 0.001 compared with media-treated DCs. (D) IFN-γ+ CD4+ T cells, as analyzed via flow cytometry, of DCs treated with OVA (10 μg/ml) for 2 h and then treated with 200 nM TRS for 6 h. The DCs were cultured with OT-II CD4+ T cells at a 1:10 ratio in the presence of anti-IL-12 antibody (Ab) (0.1–1 μg/ml) or isotype Ab (0.1–1 μg/ml) for three days. Representative figures are presented. (E) The population of IFN-γ+CD4+ T cells is presented as the mean ± SD of three independent experiments (n = 3). (F) Protein levels of IFN-γ in the supernatants, as detected by ELISA. Data shown represent the mean ± SEM of three independent experiments (n = 3). (E, F) Statistical significance was assessed using unpaired Student’s t-test; ##P < 0.01 compared with CD4+ T cells co-cultured with media-treated DCs, *P < 0.05, **P < 0.01 and ***P < 0.001 as determined by one-way analysis of variance with a Bonferroni post-test for multiple comparisons.

