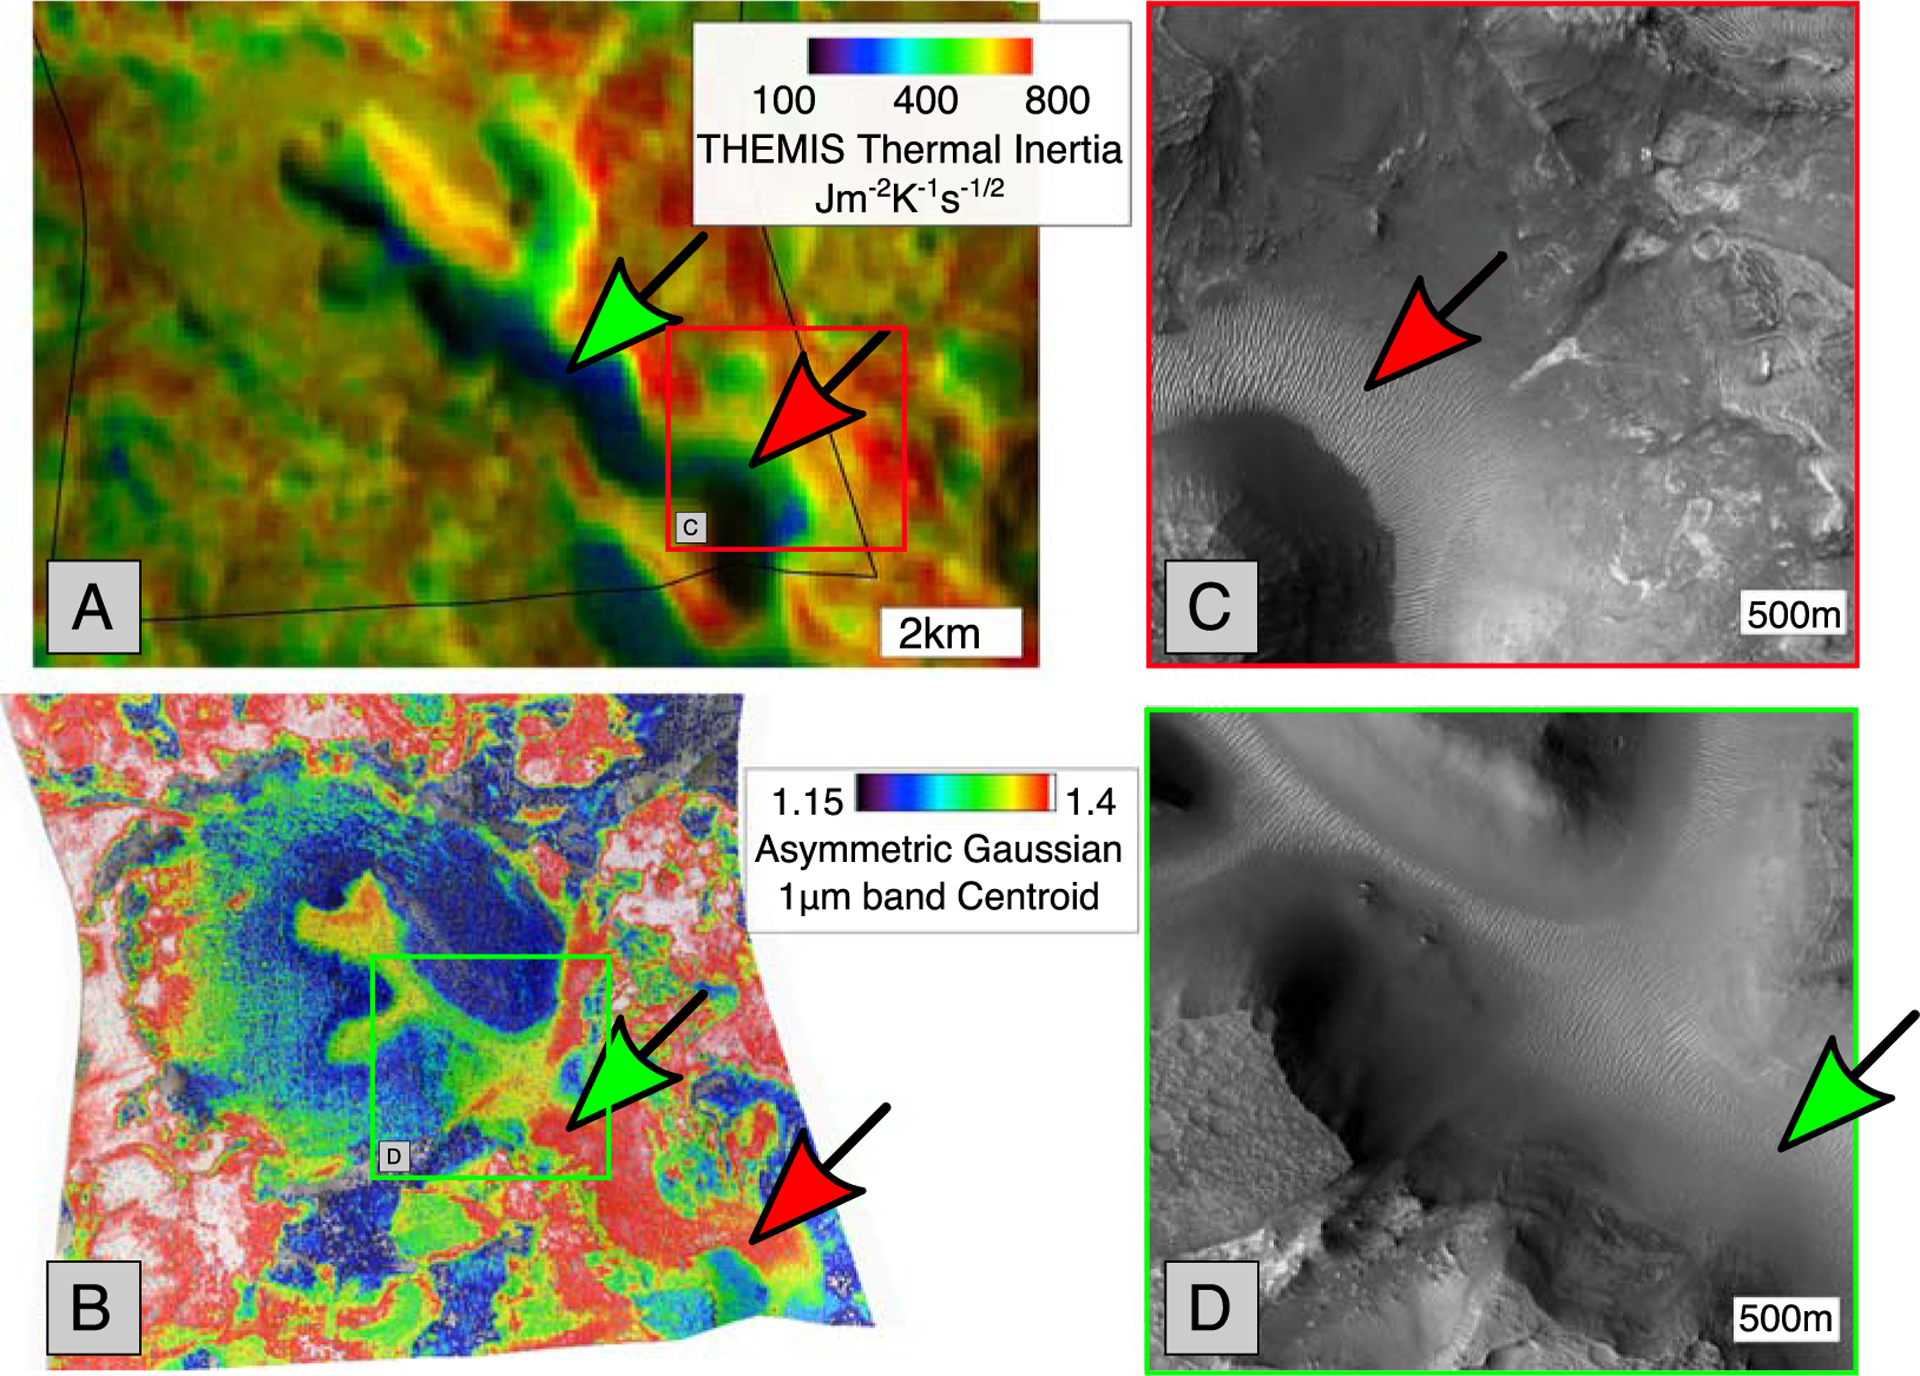
Figure 10.

(a) THEMIS thermal inertia map around CRISM image FRT3E12 (outline shown in black). (b) CRISM image 3E12 1 μm band centroid image that overlaps the THEMIS scene, showing red and green arrows pointing to redshifted olivine. (c) HiRISE image ESP_026992_2025_RED magnified showing location of dunes pointed to by red arrow. (d) HiRISE image PSP_002888_2025_RED showing magnified location of green arrow pointing to dunes in the THEMIS image (a), blue represents low thermal inertia, fine grain material, red represents bedrock, large grain size material. The red and green arrows in (a) point to blue low thermal inertia material, implying a fine grain size. In the CRISM 1 μm band image, red (and white) indicates the highest redshifted olivine. In (b) the red and green arrows point to highly redshifted material.
