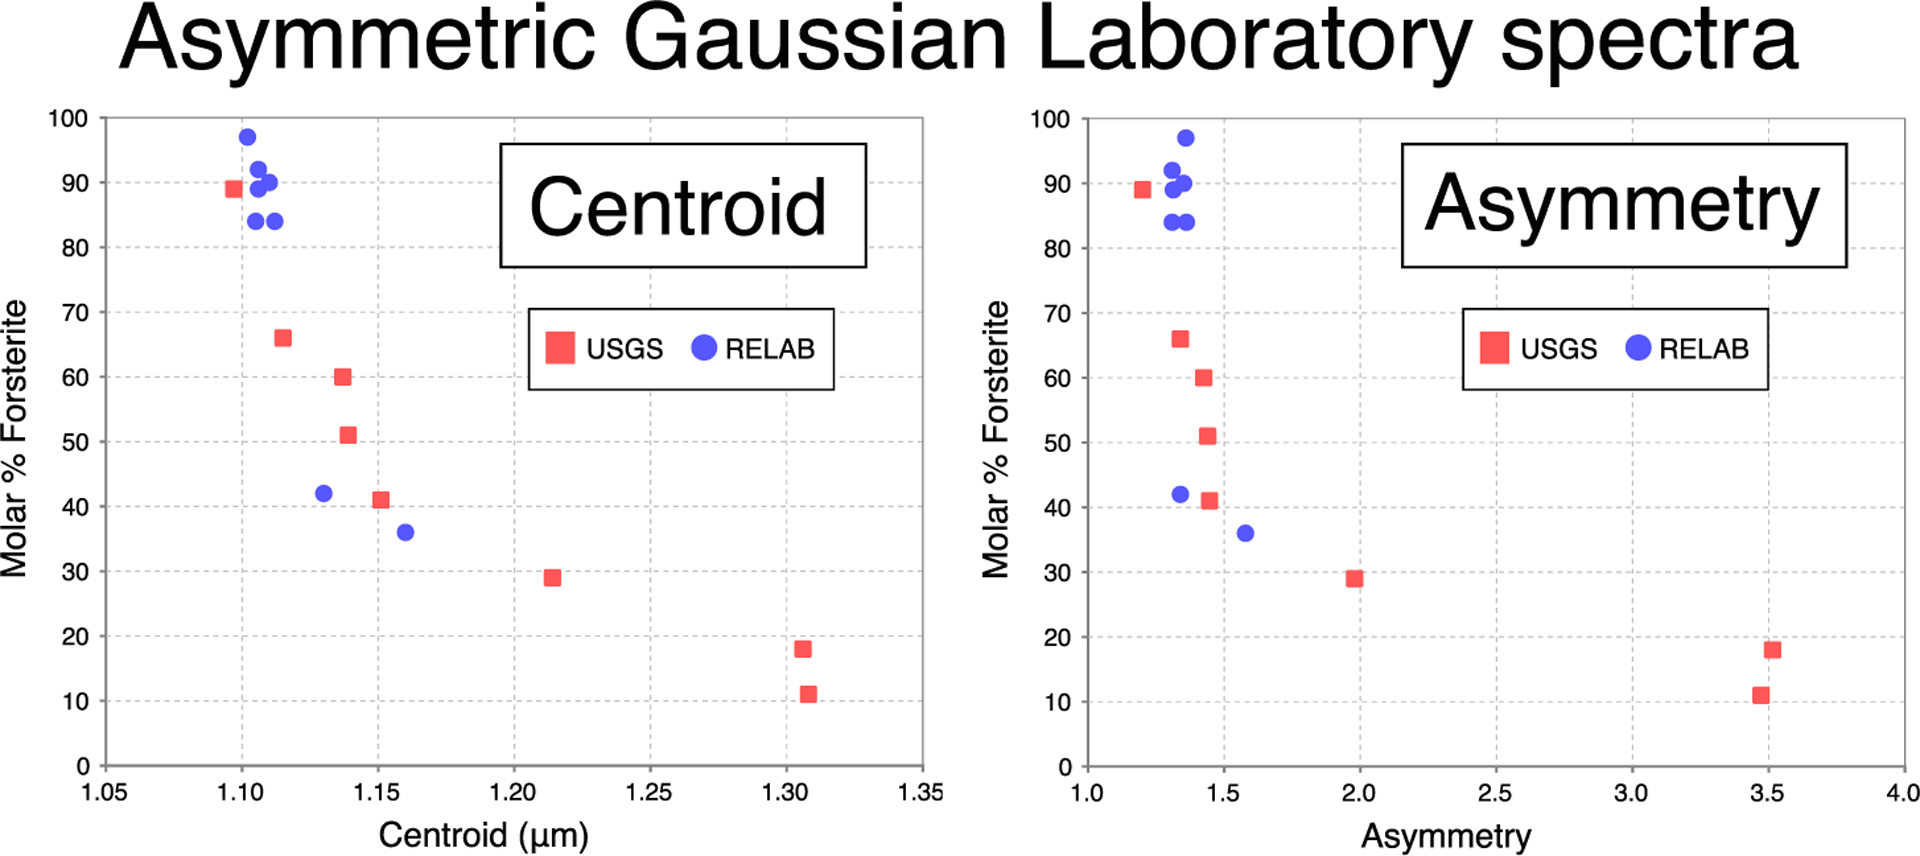
Figure 5.

Laboratory spectra asymmetric Gaussian fitting results for RELAB and USGS spectra. These demonstrate the tendency of the centroid and asymmetry to decrease with increasing Fo#. This plot includes all 16 laboratory olivine spectra that have grain size <70 microns.
