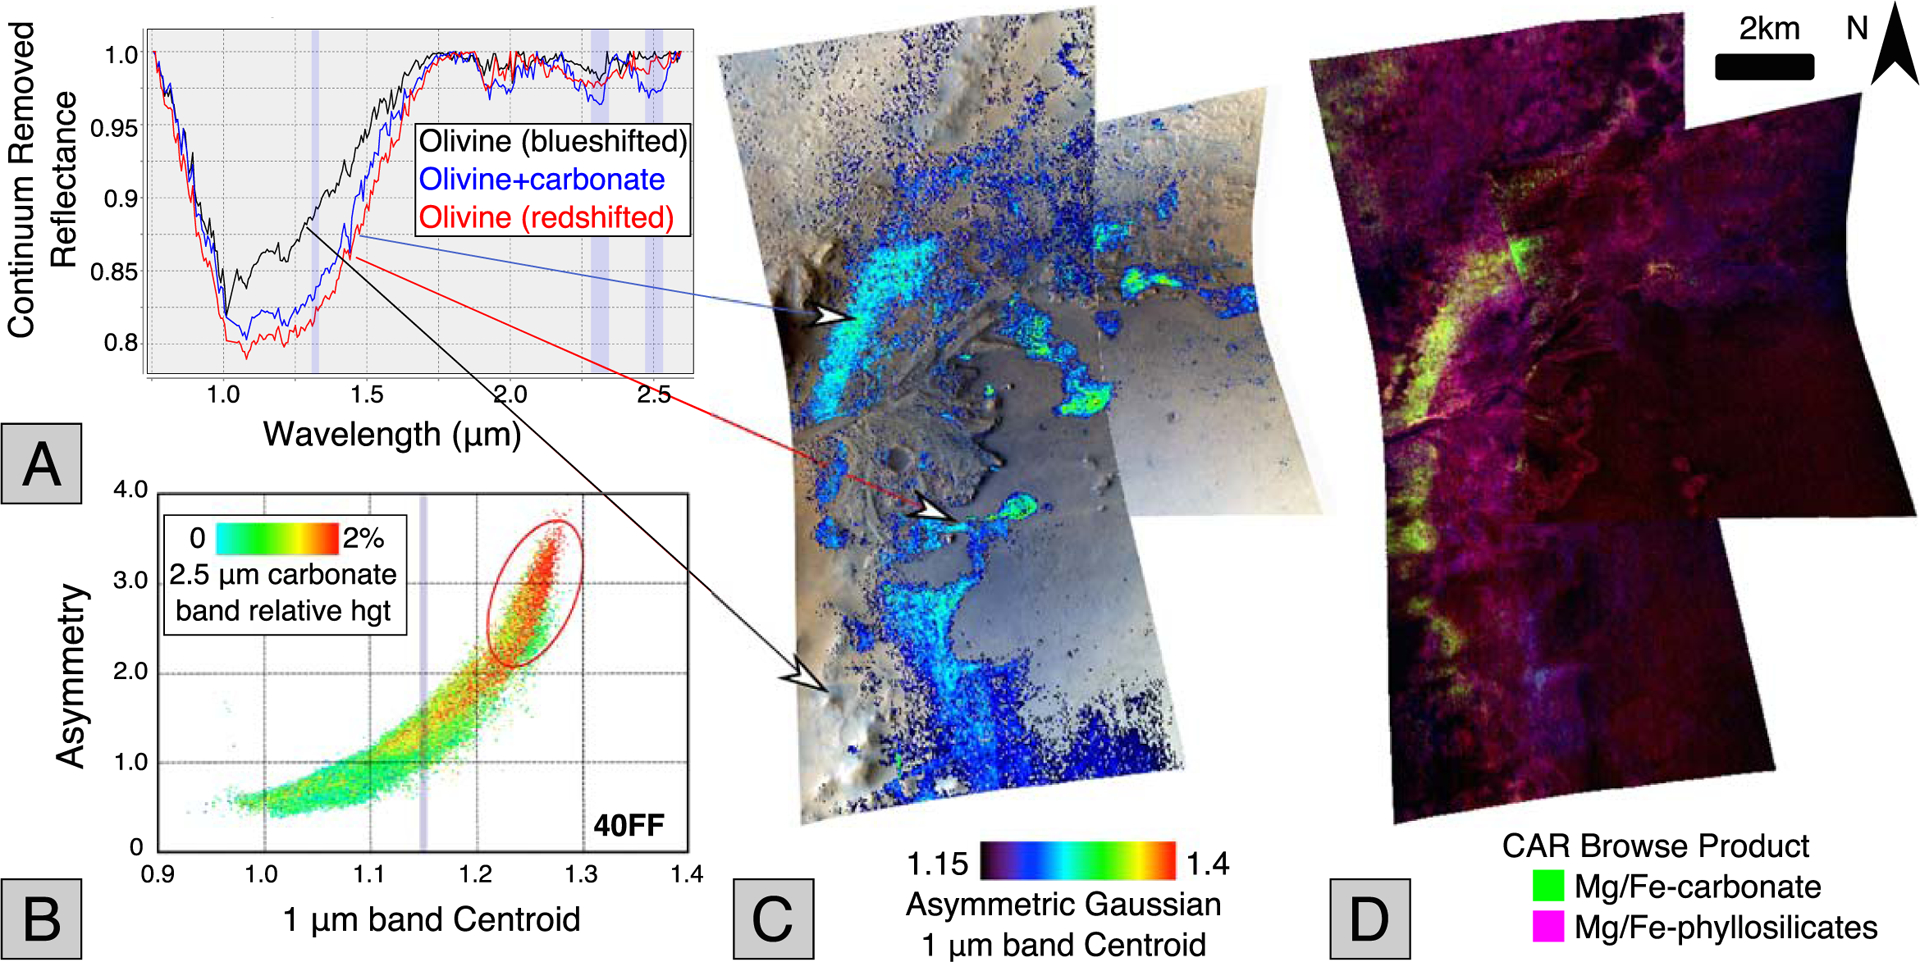
Figure 6.

(a) Example continuum removed spectra from arrowed locations in images HRL40FF and FRT47A3. The 1.3, 2.3, and 2.5 μm regions are indicated by shaded vertical regions. (b) Plot of asymmetry versus centroid position for the 1 μm absorption band, color coded for the strengths of the 2.5 μm feature indicative of carbonates for all pixels from HRL40FF. (c) Olivine 1 μm band centroid map of Jezero western delta covered by CRISM images HRL40FF and FRT47A3. Arrows show regions where example spectra were obtained. (d) CRISM CAR standard browse product of the Jezero delta, (R: D2300, G: BD2500_2, B: BD1900_2) showing regions where carbonate is present due to the presence of a 2.3 accompanied by a 2.5 μm band (bright yellow-green-white tones). Phyllosilicates with 2.3 and 1.9 μm bands are in magenta.
