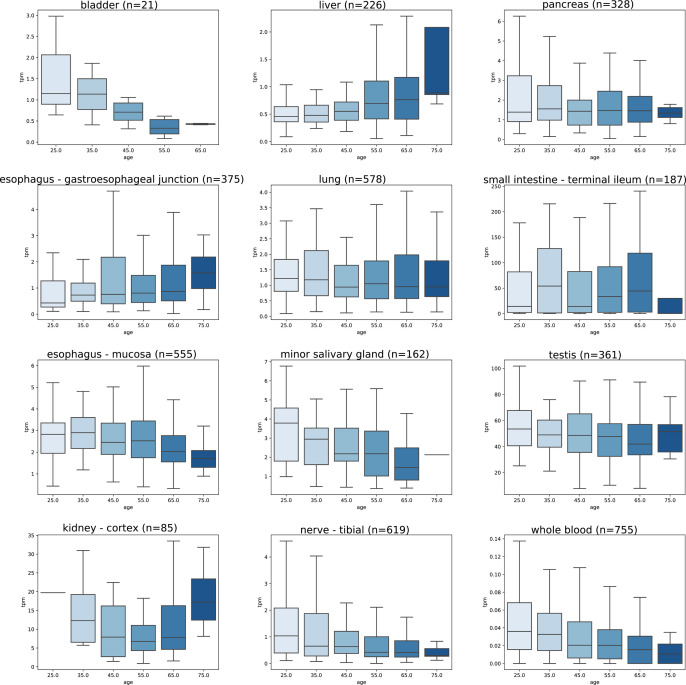
Fig 6. Effect of age on ACE2 mRNA expression levels.
Data is extracted from the GTEx dataset as TPM. In these organs, ANOVA revealed significant differences between age categories in tibial nerve (p = 8.58 x 10⁻⁶), minor salivary gland (p = 0.002), and whole blood (p = 0.005). In other tissues, the differences did not reach statistical significance. The highest TPM values are seen in the small intestine, testis, and kidney.

