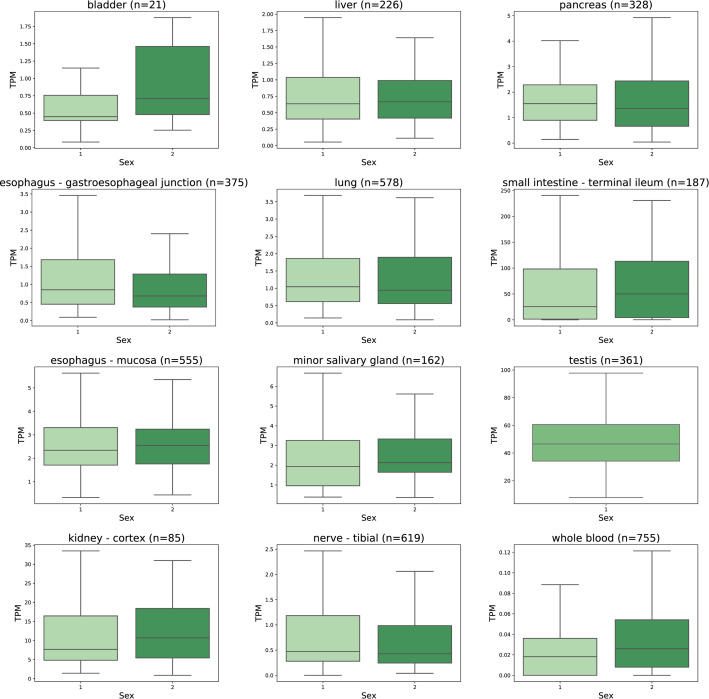
Fig 7. Effect of gender on ACE2 mRNA expression levels.
Data is extracted from the GTEx dataset as TPM. The expression levels in males and females overlap in all tissue categories. Statistically significant differences studied by ANOVA analysis were determined in esophagus-gastroesophageal junction (p = 0.024) and whole blood (p = 0.0002). The ACE2 mRNA expression levels in testis specimens are shown here for comparison. 1 = male, 2 = female.

