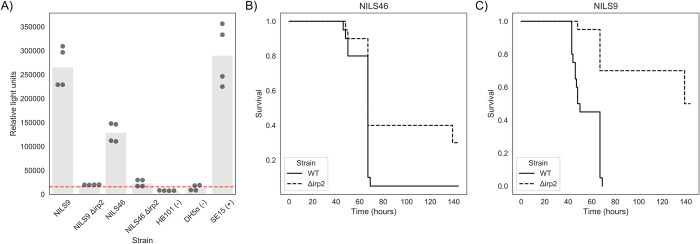
Fig 2. Phenotypic consequences of HPI deletion.
A) Deletion of HPI leads to a decrease in production of yersiniabactin. Production of yersiniabactin is measured using a luciferase-based reporter (Methods). Strains marked with a “-” and “+” sign indicate a negative and positive control, respectively. The red dashed line indicates an arbitrary threshold for yersiniabactin production, derived from the average signal recorded from the negative controls plus two standard deviations. B-C) Deletion of HPI leads to an increase in survival after infection. Survival curves for wild-type strains and the corresponding irp2 deletion mutant, built after infection of 20 mice for each strain. B) Survival curve for strain NILS46. C) Survival curve for strain NILS9.

