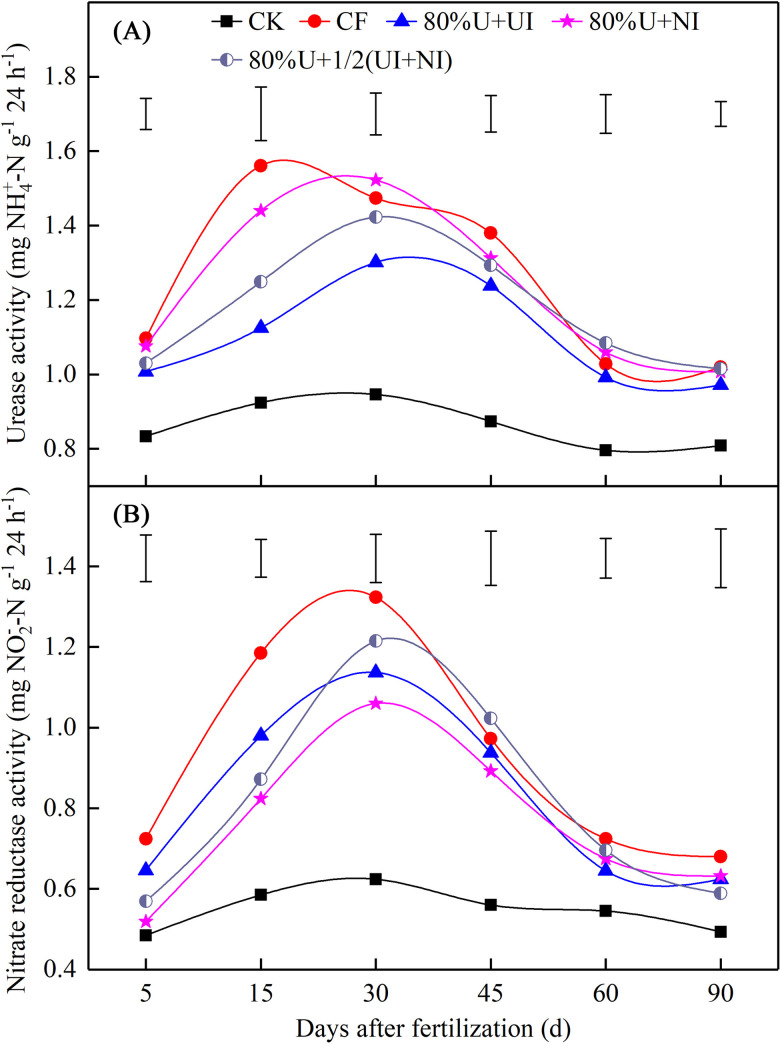
Fig 2.
The activities of urease (A) and nitrate reductase (B) under different fertilization treatments. CK, no N fertilizer input; CF, conventional fertilization; 80%U+UI, 80%U+NI and 80%U+1/2(UI+NI) indicate 80% of urea input with NBPT, with DMPP and with half NBPT and half DMPP, respectively. Vertical bars represent LSD0.05 between treatments.

