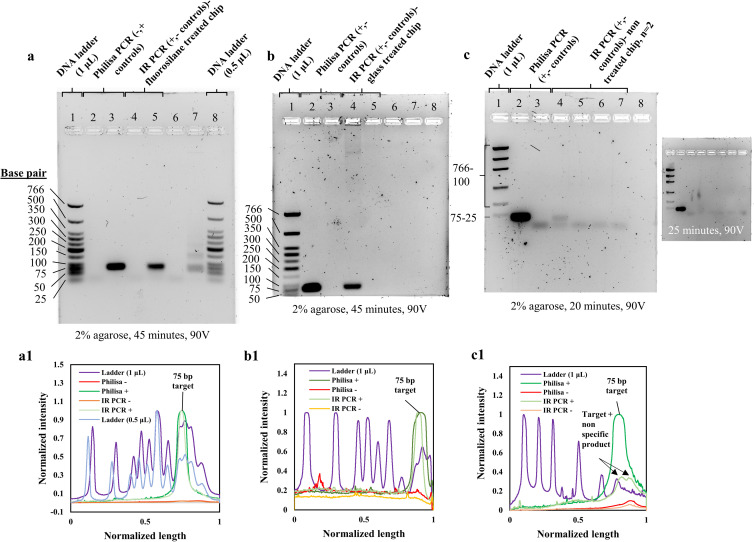
Fig 8. On-chip nucleic acid amplification reactions on 3D-printed and silane-functionalized micro-chamber chips.
(a) Band intensity analysis of positive and negative (no DNA template) control reactions on Philisa (Lane 2,3) and IR PCR thermocycler on fluorinated 3D printed chips (Lane 4,5,6,7). Loading of 1 (Lane 1) and 0.5 μL (Lane 8) low molecular weight DNA marker allowed accurate quantification of amplicon based on band-intensity. (a1) Agarose gel intensity profile plots generated in ImageJ. Base pair lengths of DNA marker have been tagged for reference to target specificity. (b) Band intensity analysis of positive and negative (no DNA template) control reactions on Philisa (Lane 2,3) and IR PCR thermocycler on glass-coated 3D printed chips (Lane 4,5), run with 1 μL (Lane 1) loading of low molecular weight DNA marker. (b1) Agarose gel intensity profile plots generated in ImageJ. PCR product bands for positive and IR PCR reaction representative peaks were tagged. (c) Band intensity analysis of positive and negative (no DNA template) control reactions on Philisa (Lane 2, 3) and IR PCR thermocycler on non-treated 3D printed chips (Lane 4,5,6,7), run with 1 μL (Lane 1) loading of low molecular weight DNA marker. The gel run for approximately 20 minutes less than the time for the gels with amplicons from treated chips, to visualize the faint amplicon, as the latter was fully absorbed in longer gel electrophoresis runs (inset in c). As a result, the ladder in this gel image is not fully separated. (c1) Agarose gel intensity profile plots generated in ImageJ. PCR product and primer bands for positive and IR PCR reaction representative peaks were tagged. (S1A_raw_images in S1 File (DOI: 10.25405/data.ncl.12320501), S1B_Amplicon_band_intensities_plots in S1 File (DOI: 10.25405/data.ncl.12320396)).

