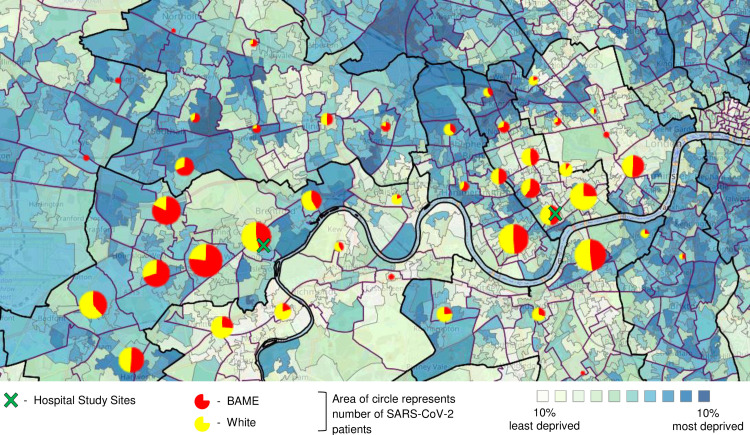
Fig 1. Geographic distribution of SARS-CoV-2 positive patients against areas of social deprivation, across a Central London population (March 1 –April 30, 2020).
Indices of Deprivation: 2019 map. http://dclgapps.communities.gov.uk/imd/iod_index.html.

