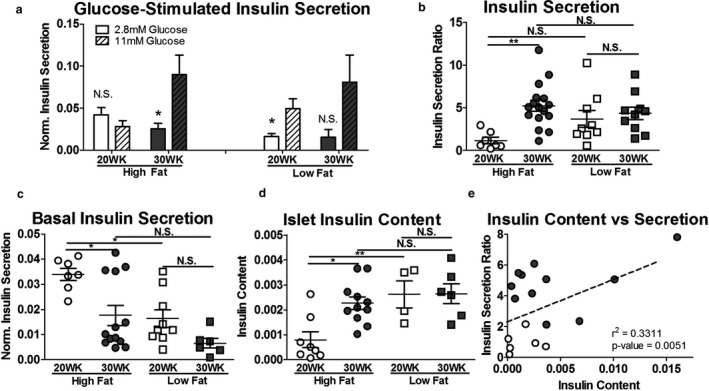
FIGURE 4.

Islet insulin secretion and insulin content. Islet insulin secretion in response to low (2.8 mM) and high (11 mM) glucose conditions, normalized by islet insulin content (a), reported as a ratio of high glucose to low glucose insulin secretion (b). Comparison of islet insulin secretion under low glucose conditions in 20‐ and 30‐week, high and low fat‐fed mice (c). Islet insulin content normalized by total protein measured via protein BCA (d). Correlation between insulin secretion ratio and islet insulin content (e). Open circles – 20‐week high fat‐fed, closed circles – 30‐week high fat‐fed. N = 8–19 mice per cohort for panels A‐C, n = 5–11 mice per cohort for panel D, n = 22 mice for panel E. *p < .05, **p < .01, ***p < .001, N.S. – Not Significant
