
FIGURE 2.
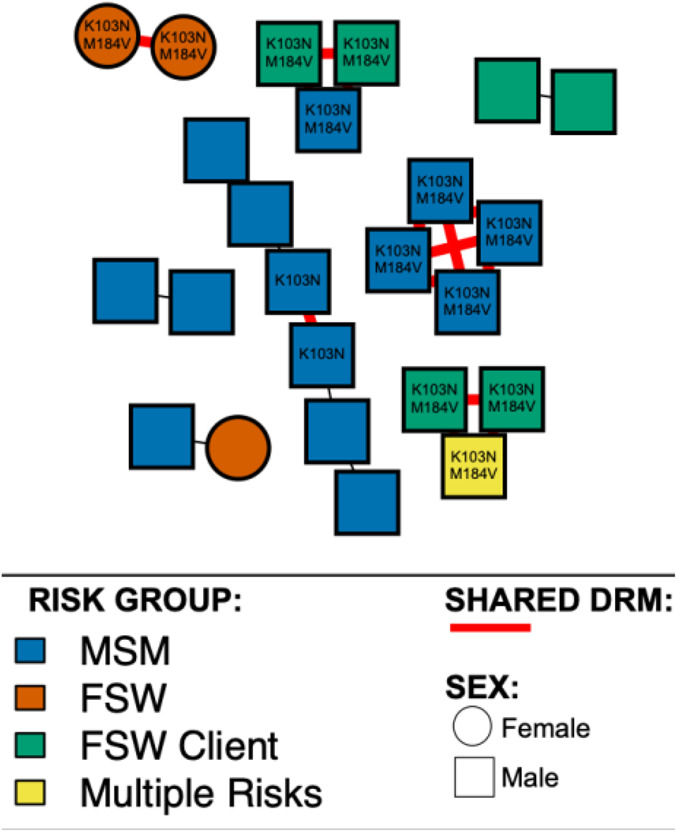
HIV drug resistance transmission among genetically linked individuals. Individuals (nodes) are shaped as square (men) and circle (women). Nodes are colored according to risk factors: blue for MSM, orange for FSWs, green for FSWs' clients, and yellow for multiple risks (MSM and FSWs' client). Shared DRMs are showed in red edges. All edges represent a genetic distance of ≤1.5% separating nodes.