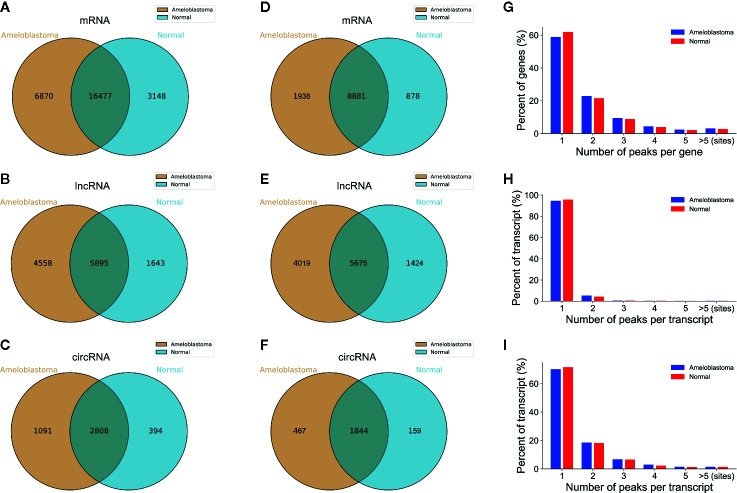
Figure 1.
Overview of m6A-modified peaks within mRNAs, lncRNAs and circRNAs in ameloblastoma and adjacent normal oral tissues. (A–C) Venn diagram depicting the overlapped and non-overlapped m6A peaks within mRNAs, lncRNAs and circRNAs between the two groups. (D–F) Venn diagram showing the differences and overlaps in m6A-modified mRNAs, lncRNAs and circRNAs between the two groups. (G-I) The number of m6A peaks per mRNA, lncRNA and circRNA between the two groups.

