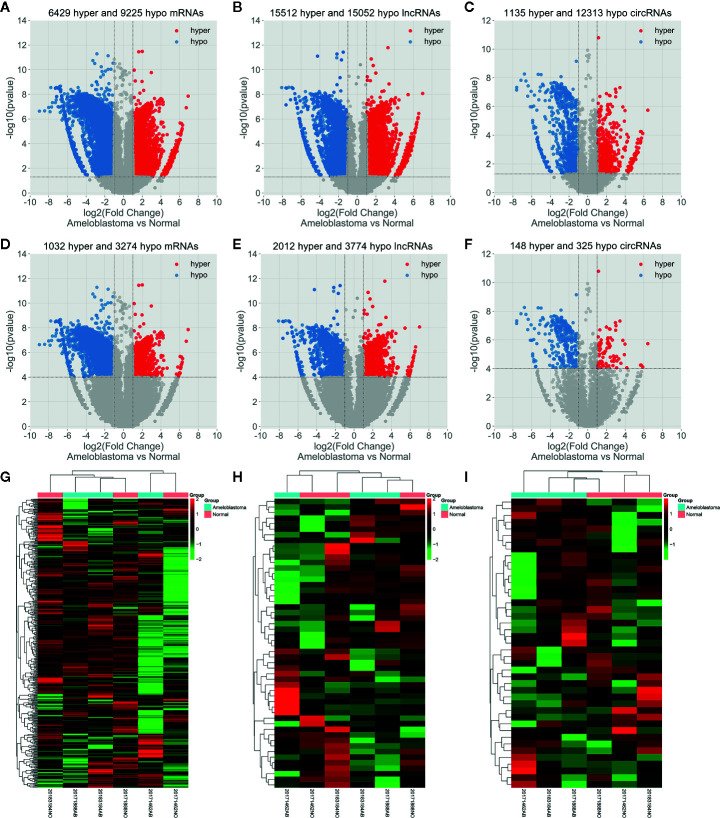
Figure 3.
Abnormal m6A-modied mRNAs, lncRNAs and circRNAs in ameloblastoma tissues compared to adjacent normal oral tissues. Volcano plots showing differentially m6A-modified mRNAs (A), lncRNAs (B) and circRNAs (C) based on |log2FC|>1 and p-value<0.05. In volcano plots, red blots represent hypermethylation and blue blots represent hypomethylation. Differentially m6A-modified mRNAs (D), lncRNAs (E) and circRNAs (F) according to |log2 FC|>1 and p-value<0.0001. (G–I) Hierarchical clustering analysis results showing the differences in m6A modification patterns within mRNAs, lncRNAs and circRNAs between ameloblastoma tissues compared to adjacent normal oral tissues according to |log2FC|>1 and p-value<0.0001. In heat maps, red suggests hypermethylation and green suggests hypomethylation.

