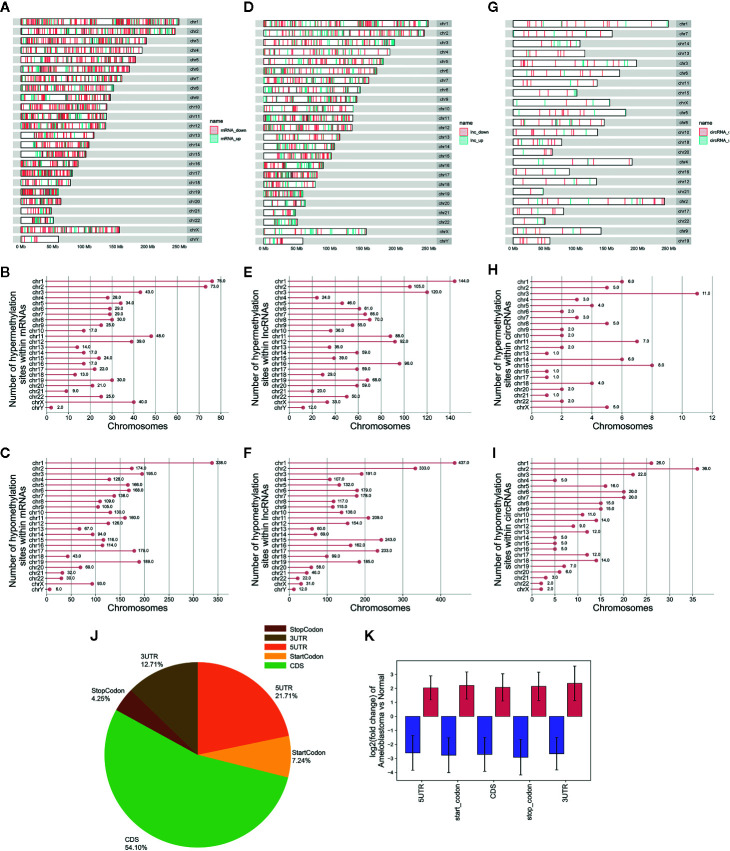
Figure 4.
Differences in distribution of differentially methylated m6A sites between ameloblastoma and adjacent normal oral tissues. Chromosomal distribution of differentially methylated m6A sites within mRNAs (A–C); lncRNAs (D–F); circRNAs (G–I). (J) Pie diagram showing the distribution of differentially methylated m6A sites in the whole transcriptome of ameloblastoma tissues and adjacent normal oral tissues. (K) The fold change of differentially methylated m6A sites in five regions between ameloblastoma and adjacent normal oral tissues. Red represents high methylation and purple represents low methylation.

