Fig. 2.
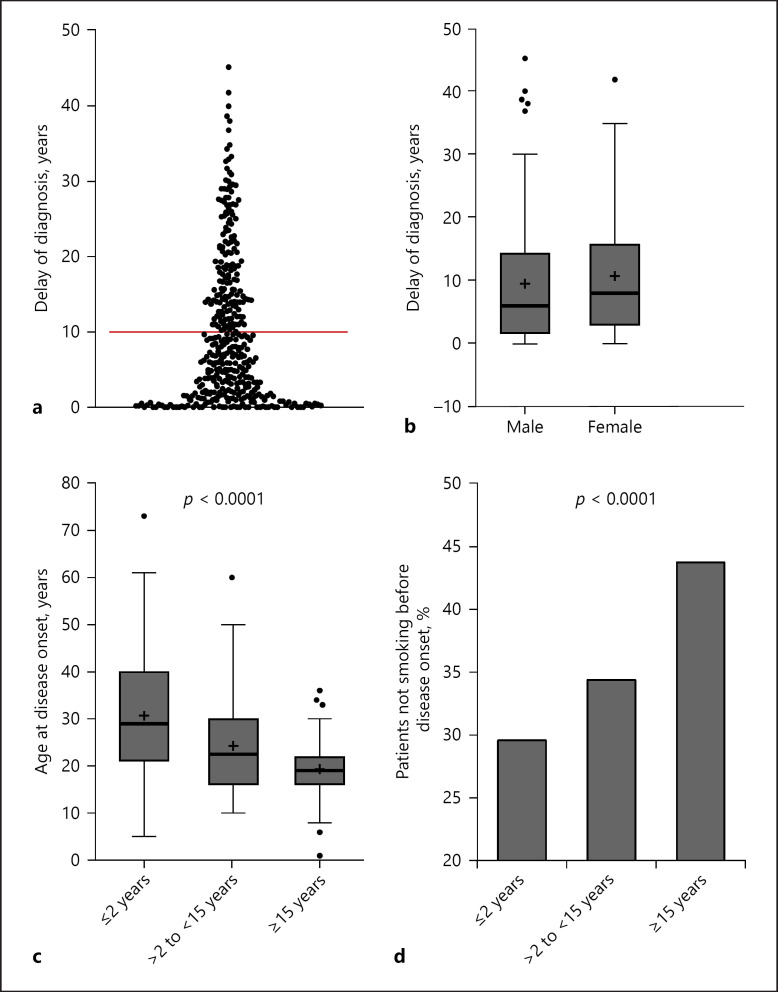
Delay of diagnosis in patients with HS. a Distribution of time in years from occurrence of first HS symptoms until diagnosis (n = 394). b Years between first symptoms and HS diagnosis in male and female patients (n = 394). c Age at disease onset in 3 patient groups with different delays in diagnosis of HS (≤2 years; >2 to <15 years; ≥15 years) since first symptoms occurred (p value of ANOVA) presented in Tukey-type box plots, with the box extending from the 25th to 75th percentiles of values, the line in the middle of the box and “+” representing the median and the mean, respectively, the maximum length of box whiskers corresponding to 1.5 times the interquartile distance, and the values plotted individually representing outliers (n = 394). d Percentage of patients in the 3 patient groups with different delay in diagnosis (n = 394), who were non-smokers before disease onset (p value of chi-square test). HS, hidradenitis suppurativa.

