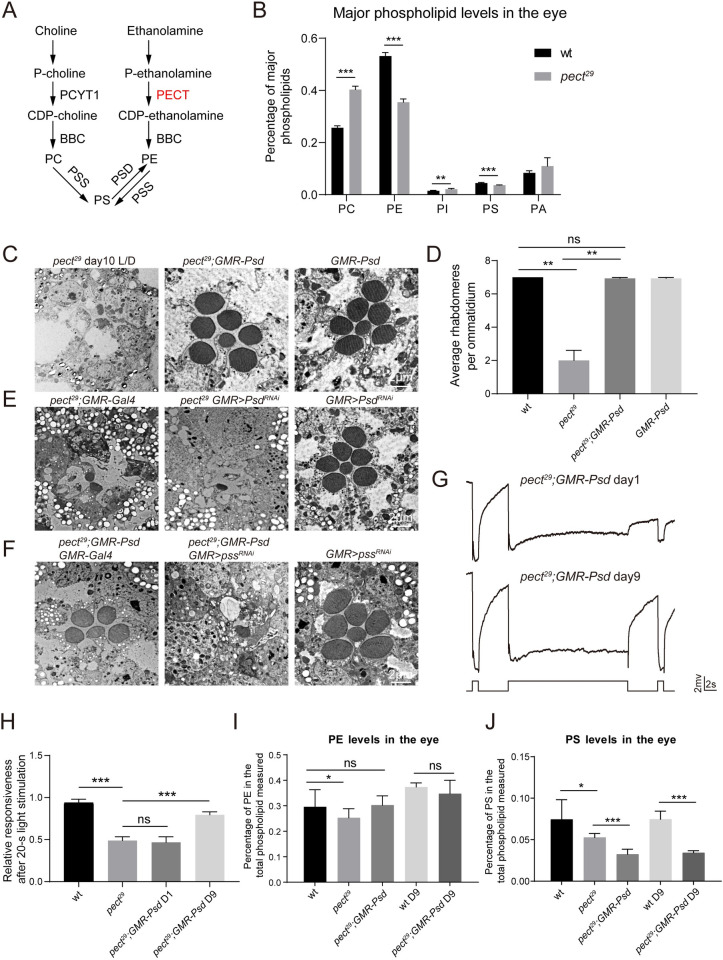
Fig 4. Overexpression of PSD restored the PE levels and suppressed the retinal degeneration and defective photoresponse in pect29 flies.
(A) Schematic view of phospholipid metabolism in Drosophila. P-choline (Phosphocholine) and P-ethanolamine (Phosphoethanolamine) are converted to CDP-choline and CDP-ethanolamine by PCYT1 or PECT, respectively. PC and PE are generated from CDP-choline or CDP-ethanolamine through actions of BBC. PS is made from PC or PE by base-exchange reactions that are catalyzed by PSS. PE in the mitochondria is generated through decarboxylation of PS by PSD. (B) Lipidomic analysis of major phospholipid levels in retina of wt and pect29 flies. Single phospholipid levels expressed in molar fractions are normalized to total phospholipids. Data are presented as mean ± SD, **p < 0.01, ***p < 0.001 (Student’s unpaired t-test). n = 6 replicates of 20 retinas per genotype. (C) Expressing PSD suppressed retinal degeneration in pect29 flies. Sections were obtained from pect29 (ey-flp rh1-GFP;pect29 FRT40A/GMR-hid CL FRT40A;GMR-vha68-1/+), pect29;GMR-Psd (ey-flp rh1-GFP;pect29 FRT40A/GMR-hid CL FRT40A;GMR-Psd/+), and GMR-Psd flies. All flies were raised for 10 days under 12h-light/12h-dark cycles. Scale bar is 2 μm. (D) Quantification of rhabdomeres per ommatidium in genotypes indicated. At least 10 ommatidia from each section of three different eyes were quantified for each genotype. All flies were raised for 10 days under 12h-light/12h-dark cycles. Data are presented as mean ± SD, ns, not significant, **p < 0.01 (Student’s unpaired t-test). (E) The knock-down of Psd enhanced the degeneration phenotype in pect29 mutants. Sections were obtained from pect29;GMR-Gal4, pect29 GMR>PsdRNAi (ey-flp rh1-GFP;pect29 FRT40A UAS-PsdRNAi/GMR-hid CL FRT40A;longGMR-Gal4/+), and GMR>PsdRNAi (UAS-PsdRNAi /+;longGMR-Gal4/+). All flies were raised for 5 days under 12h-light/12h-dark cycles. The knock-down efficiency of PsdRNAi was 45%. Scale bar is 2 μm. (F) Eye-specific knockdown of pss in pect29;GMR-Psd flies led to severe retinal degeneration. Sections were obtained from pect29;GMR-Psd GMR-Gal4 (ey-flp rh1-GFP;pect29 FRT40A/GMR-hid CL FRT40A;GMR-Psd longGMR-Gal4/+), pect29;GMR-Psd GMR>pssRNAi (ey-flp rh1-GFP;pect29 FRT40A/GMR-hid CL FRT40A;GMR-Psd longGMR-Gal4/UAS-pssRNAi), and GMR>pssRNAi (longGMR-Gal4/UAS-pssRNAi). All flies were raised for 10 days under 12h-light/12h-dark cycles. The knock-down efficiency of pssRNAi was 31%. Scale bar is 2 μm. (G) ERG recordings from 1-day-old and 9-day-old pect29;GMR-Psd flies. Flies were dark adapted for 2 min and subsequently exposed to a 1-s pulse followed by a 20-s then a 1-s pulse of orange light. (H) ERG amplitudes at the second 1-s pulse are normalized to ERG amplitudes at the first 1-s pulse. Error bars represent SD, and significant differences were determined using the unpaired Student's t-test (n = 6, ns, not significant, ***p < 0.001). (I-J) Lipidomic analysis of retinal PE (I) and PS (J) levels in genotypes indicated. PE and PS levels expressed in molar fractions are normalized to total phospholipids. Data are presented as mean ± SD, ns, not significant, *p < 0.05, ***p < 0.001 (Student’s unpaired t-test). n = 5 replicates of 12 retinas per genotype.

