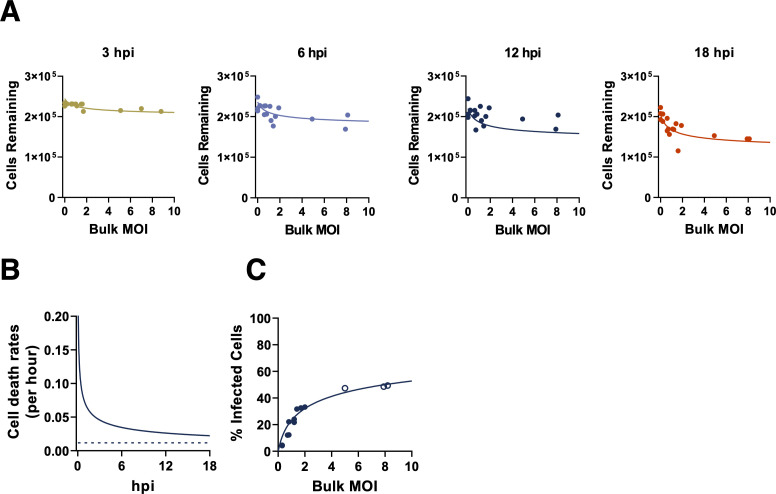
Fig 3. A549 cell death rates are time-dependent and input-independent.
(A) The numbers of A549 cells surviving following infection, as determined by by trypan blue exclusion at the indicated timepoints across our experimental range of bulk MOIs. Values represent the number of trypan blue negative cells in each sample. Lines indicate the best model fit to these data, given by the time-dependent, input-independent cell death rate model, as parameterized in S2 Table. (B) Estimated A549 cell death rate (solid) and the constant background cell death model (dashed), fitting to both mock infected cells and MOI treatments over the course of infection. (C) Percent of surviving A549 cells that are infected at 18 hpi (FACS data). The line indicates the negative binomial distribution (r = 0.338; S2 Table) with time-dependent input-independent cell death rate model fit evaluated at 18 hpi. Data from the highest bulk MOI were excluded from model fits due to the lack of confidence in the accuracy of FACS measurements at the highest MOI examined.

