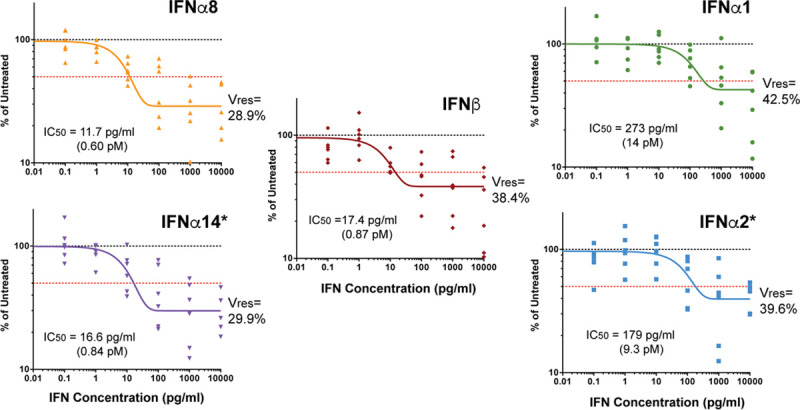
Fig 1. HIV-1 inhibition curve of IFNβ.

LPMCs (n = 6 donors) were infected with HIV-1BaL then resuspended with various doses of IFN-Is. After 4 d, the frequencies of HIV-1 p24+ cells were evaluated on CD3+CD8- cells via flow cytometry. Data were normalized to mock (untreated) as 100% for each donor. Dose-response curves were generated using a one-phase decay equation in GraphPad Prism 5.0 to determine IC50 values. Vres, the percentage of cells that remain infected relative to the mock at the maximum dose tested, corresponded to plateau values from the decay equation. *Note that data on IFNα14 and IFNα2 were previously published [13].
