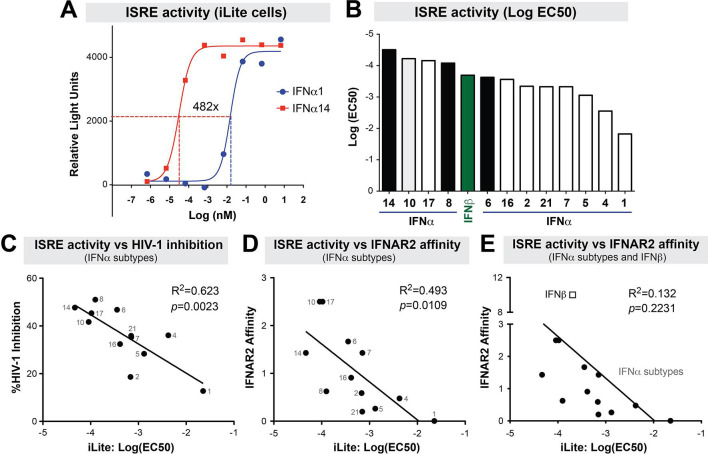
Fig 2. ISRE-activity of IFN-Is.
IFNα subtypes and IFNβ were titrated in iLite cells, a luciferase reporter cell line encoding the ISG15-ISRE. (A) Determination of ISRE-activity. Serial dilutions of IFN-Is were incubated with iLite cells and luciferase readings were determined after 18 h. In this example, the titration curves for IFNα1 and IFNα14 are shown, showing a 482-fold difference in ISRE EC50 values. (B) ISRE-activity of IFN-Is. EC50 values are shown for all IFN-Is tested. IFNα subtypes that had potent activity against HIV-1 in a previous study are highlighted in black. IFNβ is highlighted in green. Note that the EC50s are negative log values; thus the higher the bar, the less concentration is needed to achieve an EC50. (C) ISRE-activity versus HIV-1 inhibition. HIV-1 inhibition values were previously reported [12] showing % inhibition of HIV-1 p24+ cells relative to mock in LPMC cultures. ISRE-activity versus IFNAR2 binding affinity (D) without or (E) with IFNβ. IFNAR2 binding affinity data were previously reported using surface plasmon resonance. For panels C to E, linear regression curves were plotted using Prism 5.0 and evaluated using Pearson statistics.

