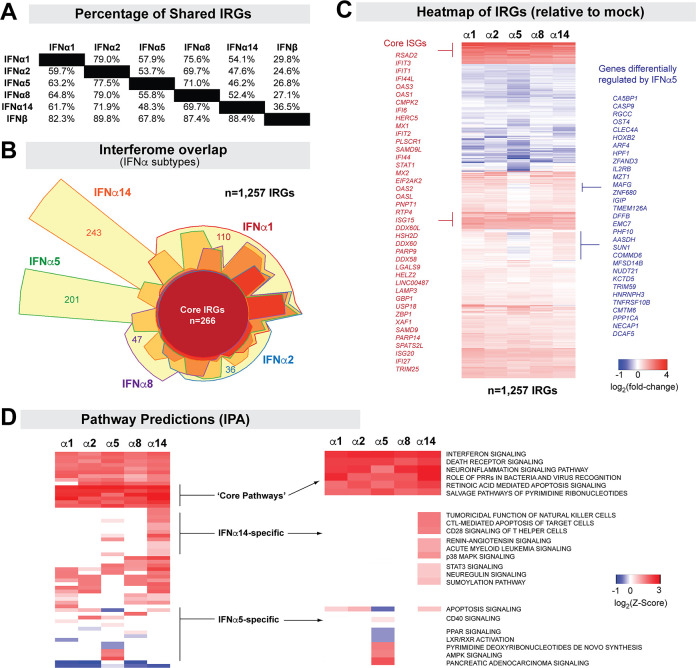
Fig 4. Interferome Differences between the IFNα subtypes.
(A) Percentage of shared IRGs. The denominators used for the top diagonal half were the left column, whereas the denominators used for the lower diagonal half were the top rows. For example: 79.0% of IFNα2-regulated genes were found among IFNα1-RGs, whereas 59.7% of IFNα1-RGs were found among IFNα2-RGs. (B) Euler diagram showing the interferome overlap between the 5 IFNα subtypes tested. A core set of 266 IRGs altered by all 5 IFNα subtypes were detected. IFNα-subtype specific genes were highlighted (e.g., 243 for IFNα14, 201 for IFNα5). The total number of IRGs (n = 1,257) include genes not shown that were shared between 2 to 4 IFNα subtypes. (C) Heatmap of IRGs from distinct IFNα subtypes. Highlighted areas in red correspond to core ISGs, whereas those in blue correspond to genes differentially regulated by IFNα5 relative to the four other IFNα subtypes tested. (D) Ingenuity Pathway Analyses of IFNα subtypes, highlighting Z-scores for shared pathways and those predicted to be specific to IFNα5 and IFNα14.

