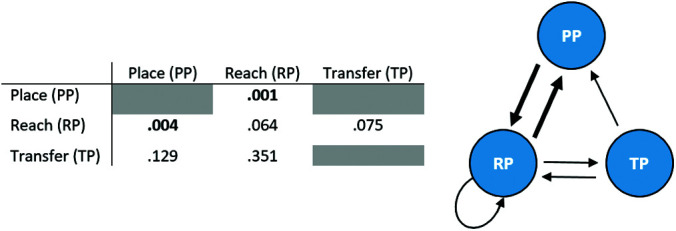
Figure 5.

Statistical comparison results (p values) based on the surgeme transition counts for the peg transfer task, and the corresponding transition diagram. Bold values and arrows with increased weight, denote a significant difference in the transition counts between the two groups.
