
Fig. 2.
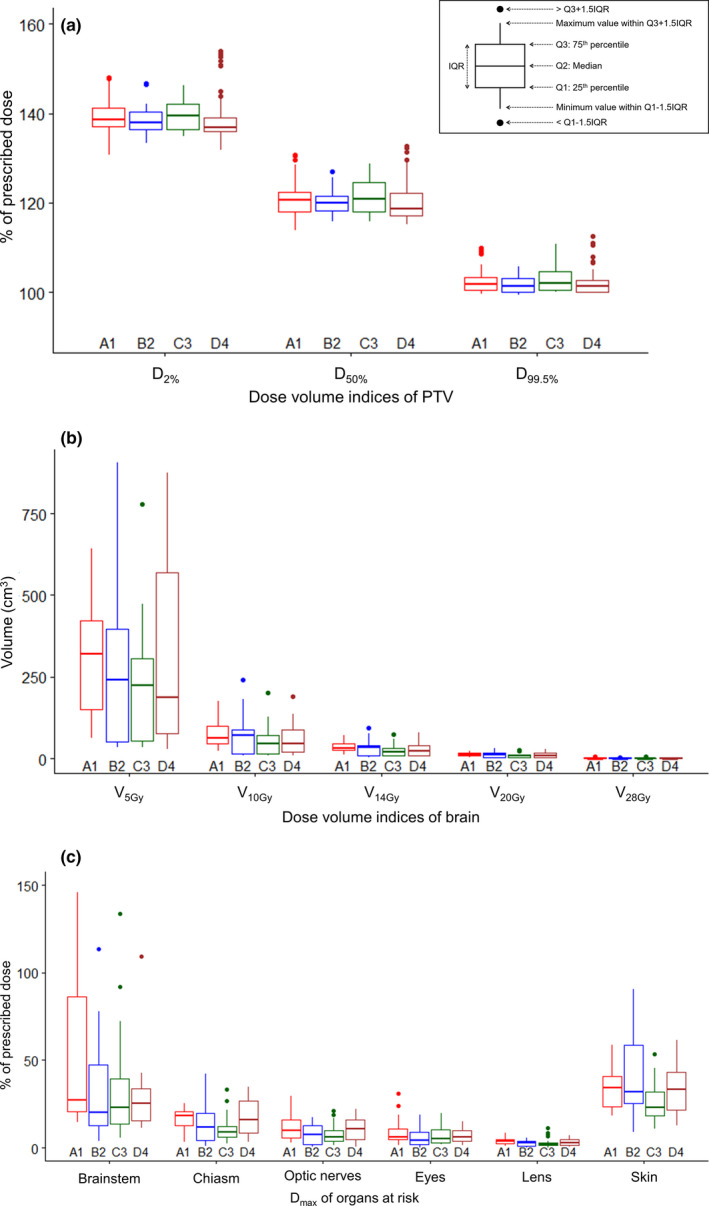
The box‐and‐whisker plots of the dose‐volume indices (DVIs) of (a) the planning target volume (PTV), (b) normal brain, and (c) other organs at risk (OARs): comparison of KBP‐A1, B2, C3, and D4 in the fourfold CV phase. The boxes represent the interquartile range (IQR). Low outliers are below the first quartile minus 1.5 × IQR and high outliers are above the third quartile plus 1.5 × IQR. DXX% = the dose to XX% of the target volume, VXXGy = the volume receiving XX Gy, Dmax = the maximum dose to the volume.