
Fig. 4.
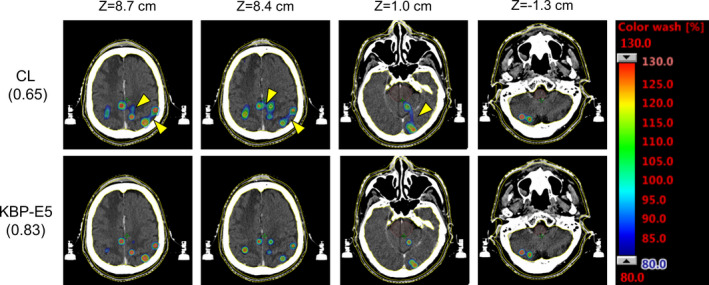
The representative dose distributions of the CL and the knowledge‐based plan (KBP) for a patient with 16 PTVs. The modified Ian Paddick Conformity Index (mIPCI) is shown in parentheses. The high‐dose spillage between the target volumes was minimized, as shown by yellow arrows.