
Fig. 2.
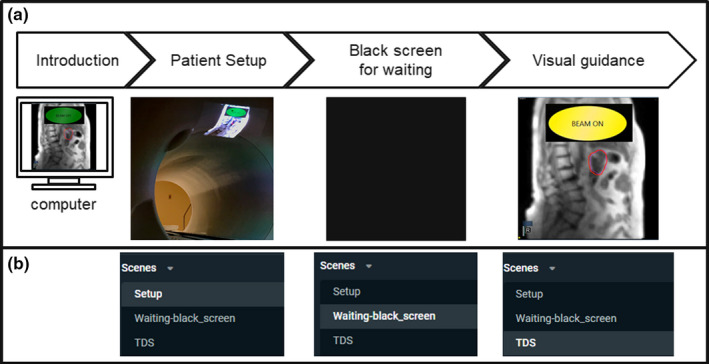
Clinical workflow of the direct tumor visualization. (a) Workflow diagram and corresponding example displays, and (b) Corresponding scene options on the live streaming software, Streamlabs open broadcast software.
Official websites use .gov
A
.gov website belongs to an official
government organization in the United States.
Secure .gov websites use HTTPS
A lock (
) or https:// means you've safely
connected to the .gov website. Share sensitive
information only on official, secure websites.
Clinical workflow of the direct tumor visualization. (a) Workflow diagram and corresponding example displays, and (b) Corresponding scene options on the live streaming software, Streamlabs open broadcast software.