
Fig. 4.
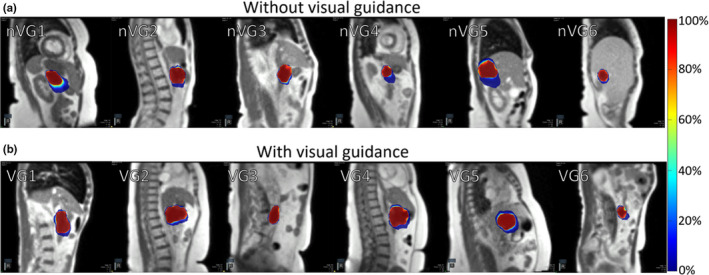
Distribution of auto‐segmented target contour from cine magnetic resonance imaging (MRI) without visual guidance (a), and with visual guidance (b) for a single fraction of six patients for each group. Individual patients are indicated by nVG(#) for no visual guidance and VG(#) with visual guidance in place. The color bar scale indicates the percent of frames that the region was encompassed by the auto‐segmented target contour.