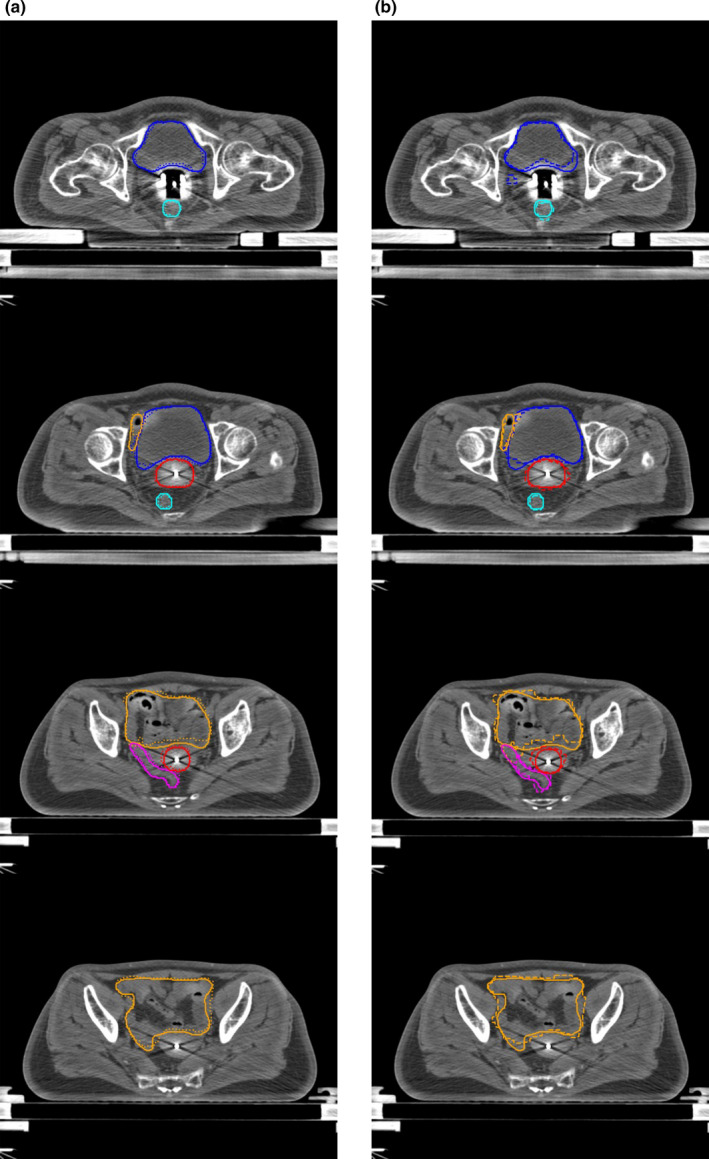
Fig. 4.

Segmentation results of a representative case (testing case 8). (a) shows the segmentation results with DSD‐UNET, (b) shows the segmentation results with 3D U‐Net. Solid lines indicate the ground‐truth segmentation, dotted and dashed lines indicate segmentations with DSD‐UNET and 3D U‐Net, respectively. (Blue contours: Bladder, Orange contours: Small intestine, Magenta contours: Sigmoid, Cyan contours: rectum, red contours: HR‐CTV)
